Logs
Logging is a key element when you need to diagnose failures. Logging allows you to view and explore inner working details that would be very hard to understand otherwise. This article contains a few sample use cases for logging.
Logs configuration is in the appsettings.json file:
"Logging": {
  "LogLevel": {
    "Default": "Information",
    "Microsoft": "Warning",
    "Microsoft.Hosting.Lifetime": "Information",
    "Microsoft.AspNetCore.SignalR": "Debug",
    "Microsoft.AspNetCore.Http.Connections": "Debug"
  }
}
Which basically defines different levels of severity that will be sent to Application Insights.
The logging infrastructure of .NET supports getting a logger with a LoggerFactory, or just by requesting an ILogger through Dependency Injection (DI) in the class constructor as shown here:
public class MyClass
{
    private readonly ILogger<MyClass> _logger;

    public MyClass(ILogger<MyClass> logger) => _logger = logger;

    // If you have to use ILoggerFactory, change the constructor like this:
    public MyClass(ILoggerFactory loggerFactory) => _logger = loggerFactory.CreateLogger<MyClass>();
}
Logging events is pretty simple, as shown in the following code that produces the trace shown in image above:
_logger.LogInformation("Publishing integration event: {pubEvent.EventId} from {Program.AppName} - ({pubEvent.IntegrationEvent})");This section will cover the benefits of logs within Application Insights. To get more info how to configure AppInsights visit this page.
AppInsights has powerful query language that allow us to scan logs in various different way.
For instance, we can get the top most popular error on a specific browser. Such query will return to us data row result. Which that could be filtered by the "level" of the events shown, such as Debug, Information, Warning or limited by DateTime to show only a specific period of time.
exceptions
| where notempty(client_Browser) and client_Type == 'Browser'
| summarize total_exceptions = sum(itemCount) by problemId
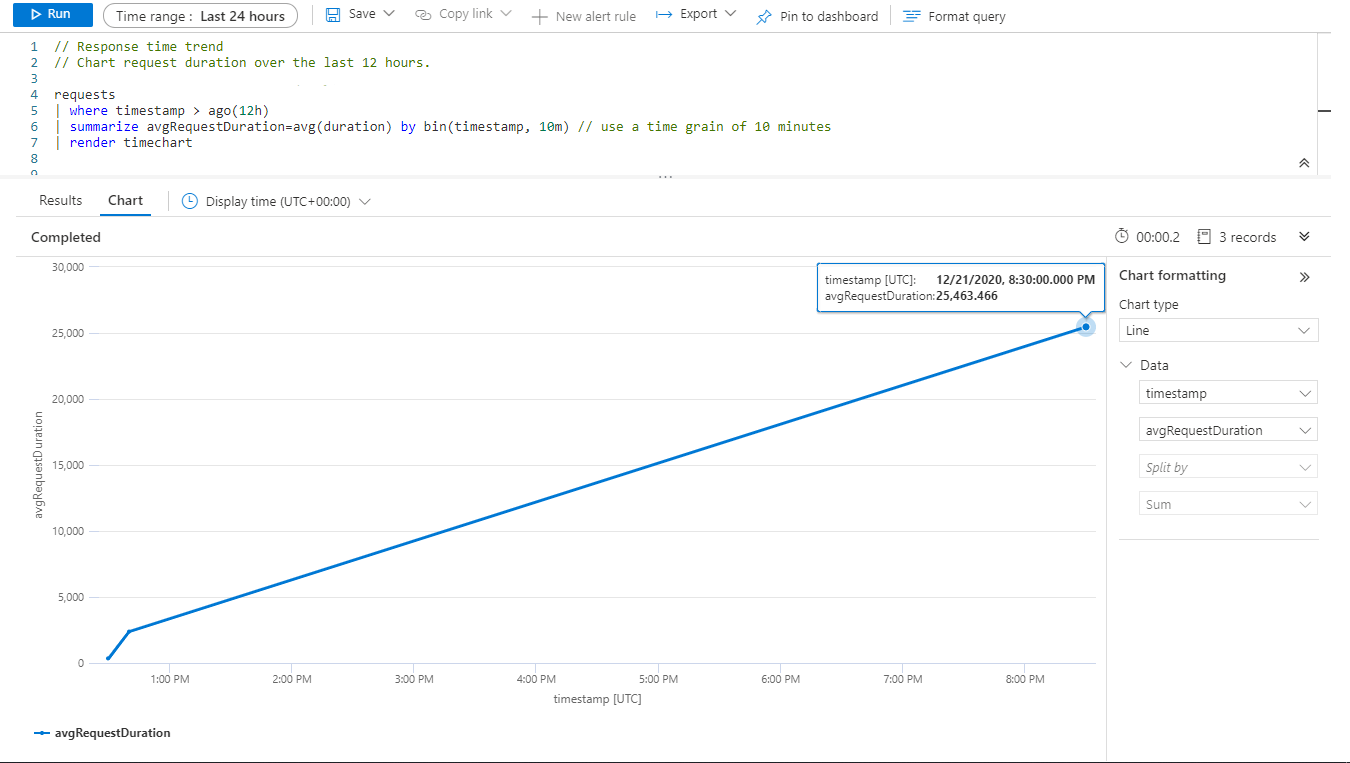
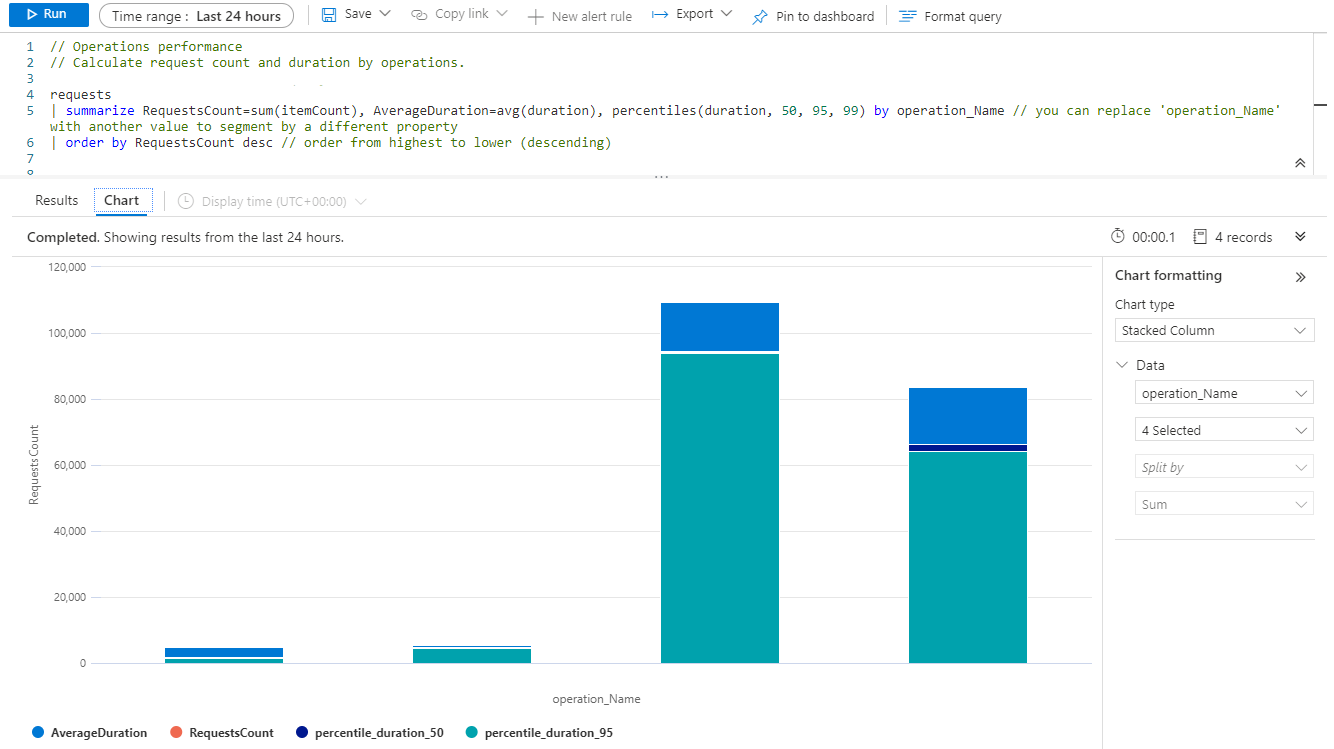
| top 3 by total_exceptions descYou can focus not only on logs but gather performance statistic based on those.
Some built in Application Insigths logs could be used to display average request duration.