Rebase LSTOD #149
Rebase LSTOD #149
Conversation
apparently after recent LST PRs |
|
I think everything is good on my end to push this pr. |
|
I'll resolve the conflict and add an option to the build script to enable the extra outputs. I'll let you know so you can test that everything works well. |
417443d to
43311a5
Compare
|
@Hoobidoobidoo instead of adding additional options and flags, I decided to use the existing I verified that it compiles (after fixing a couple of typos I made), but could you also verify that the output ntuple contains all the data you want and that it looks good? |
|
/run all |
|
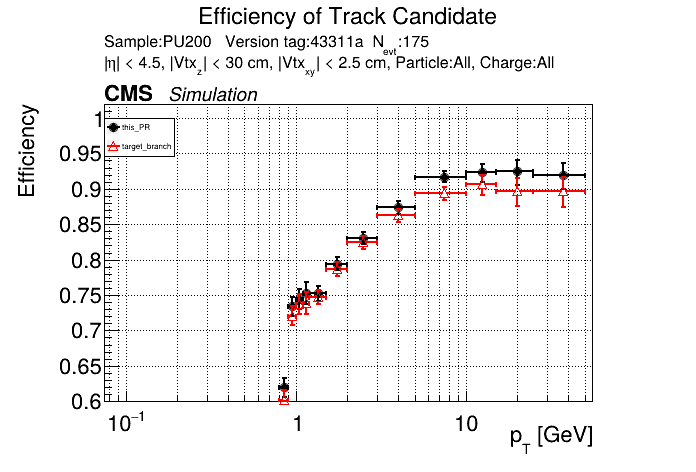
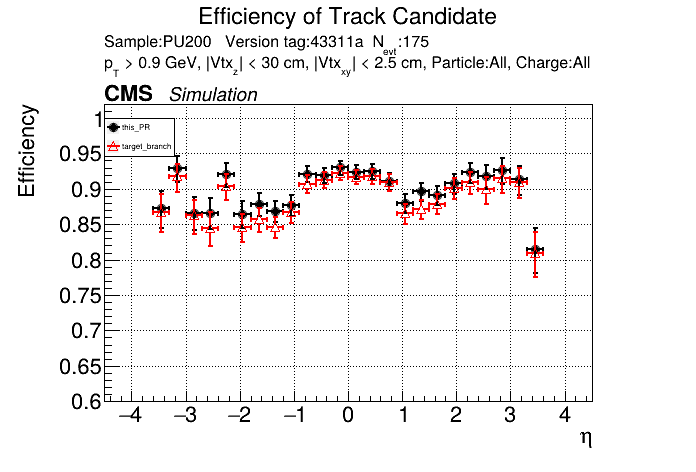
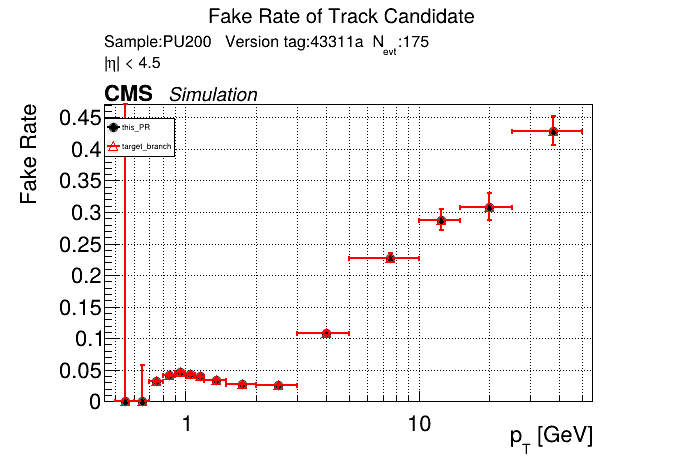
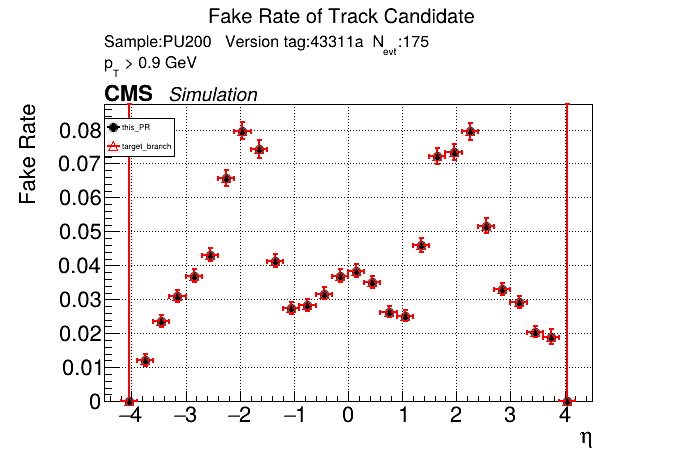
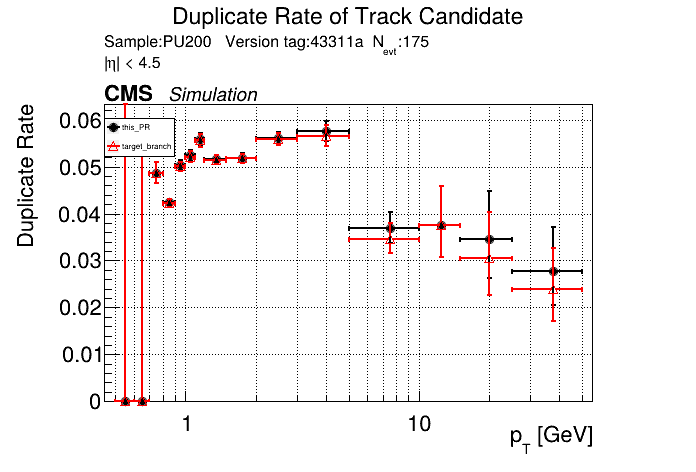
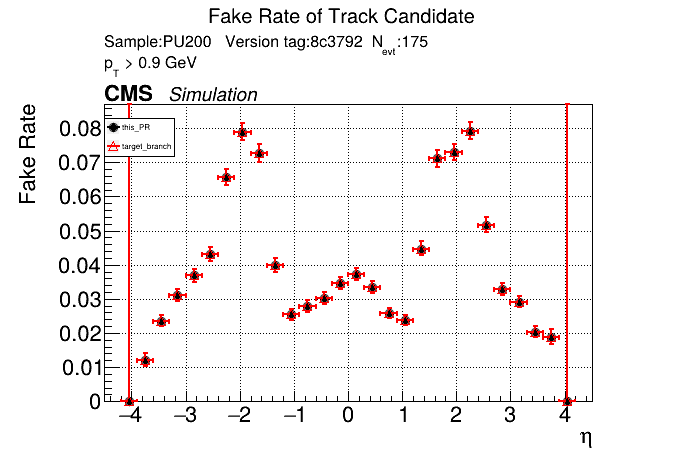
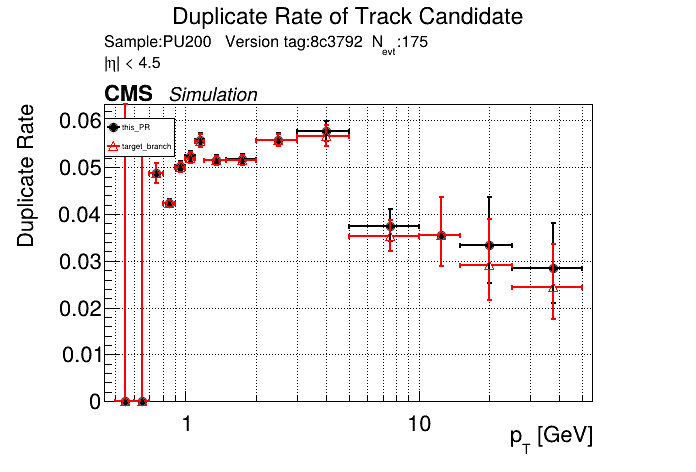
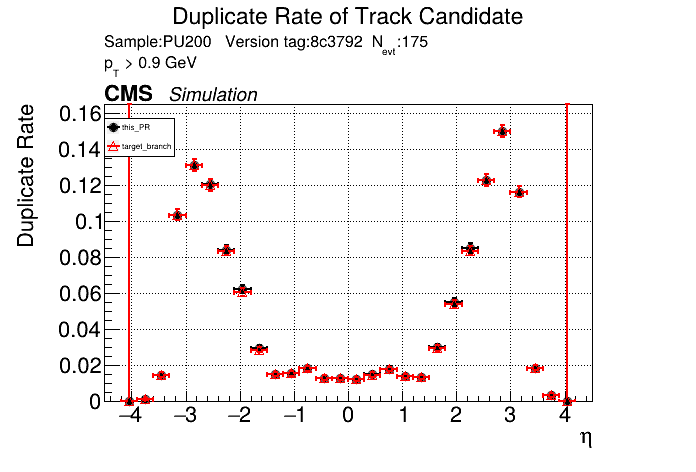
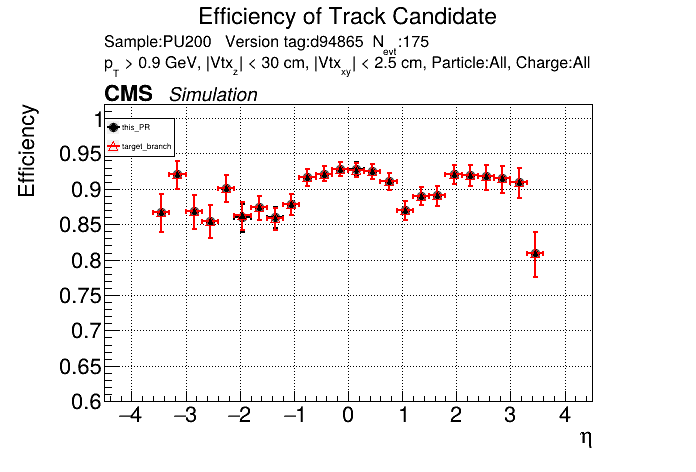
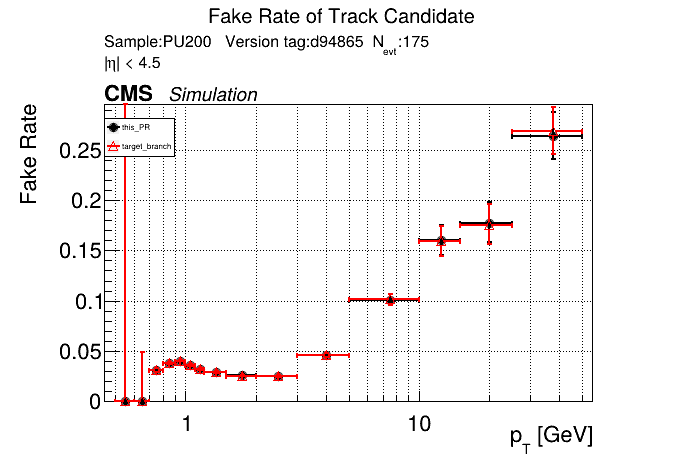
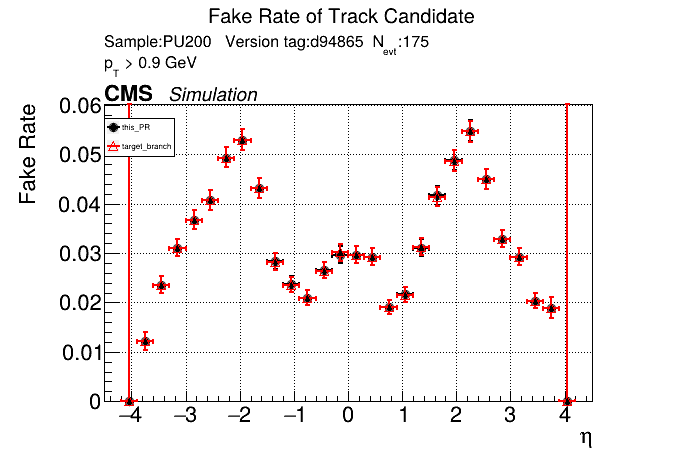
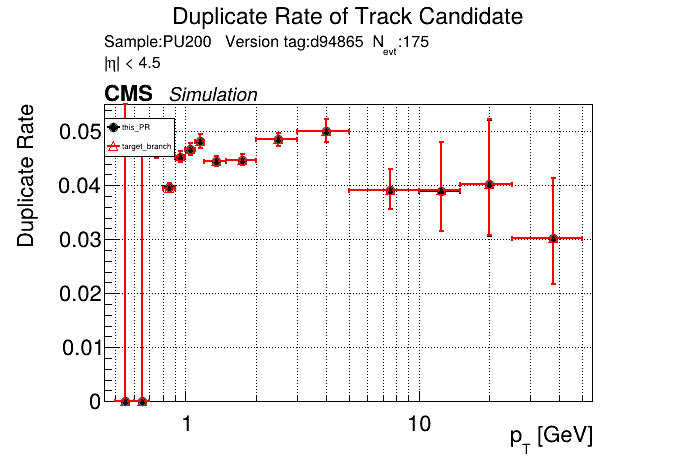
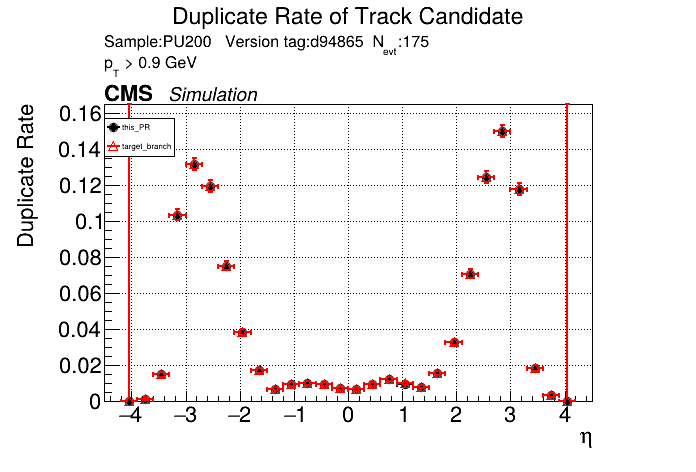
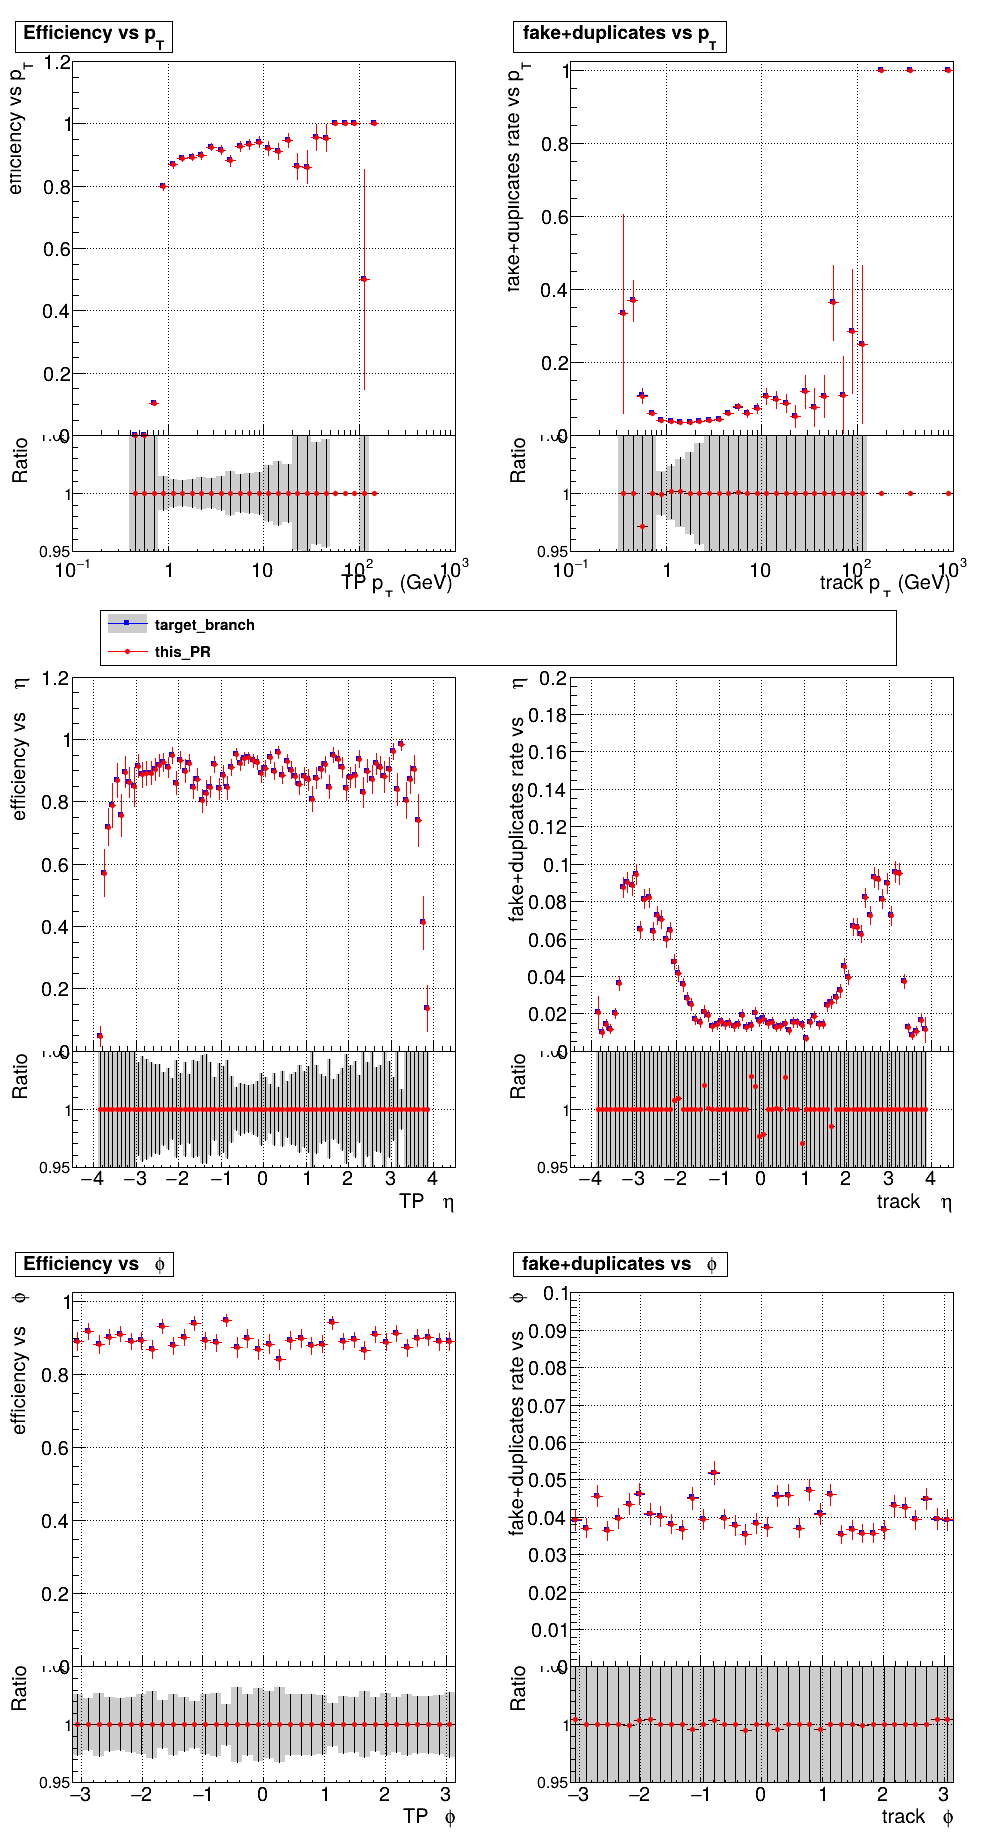
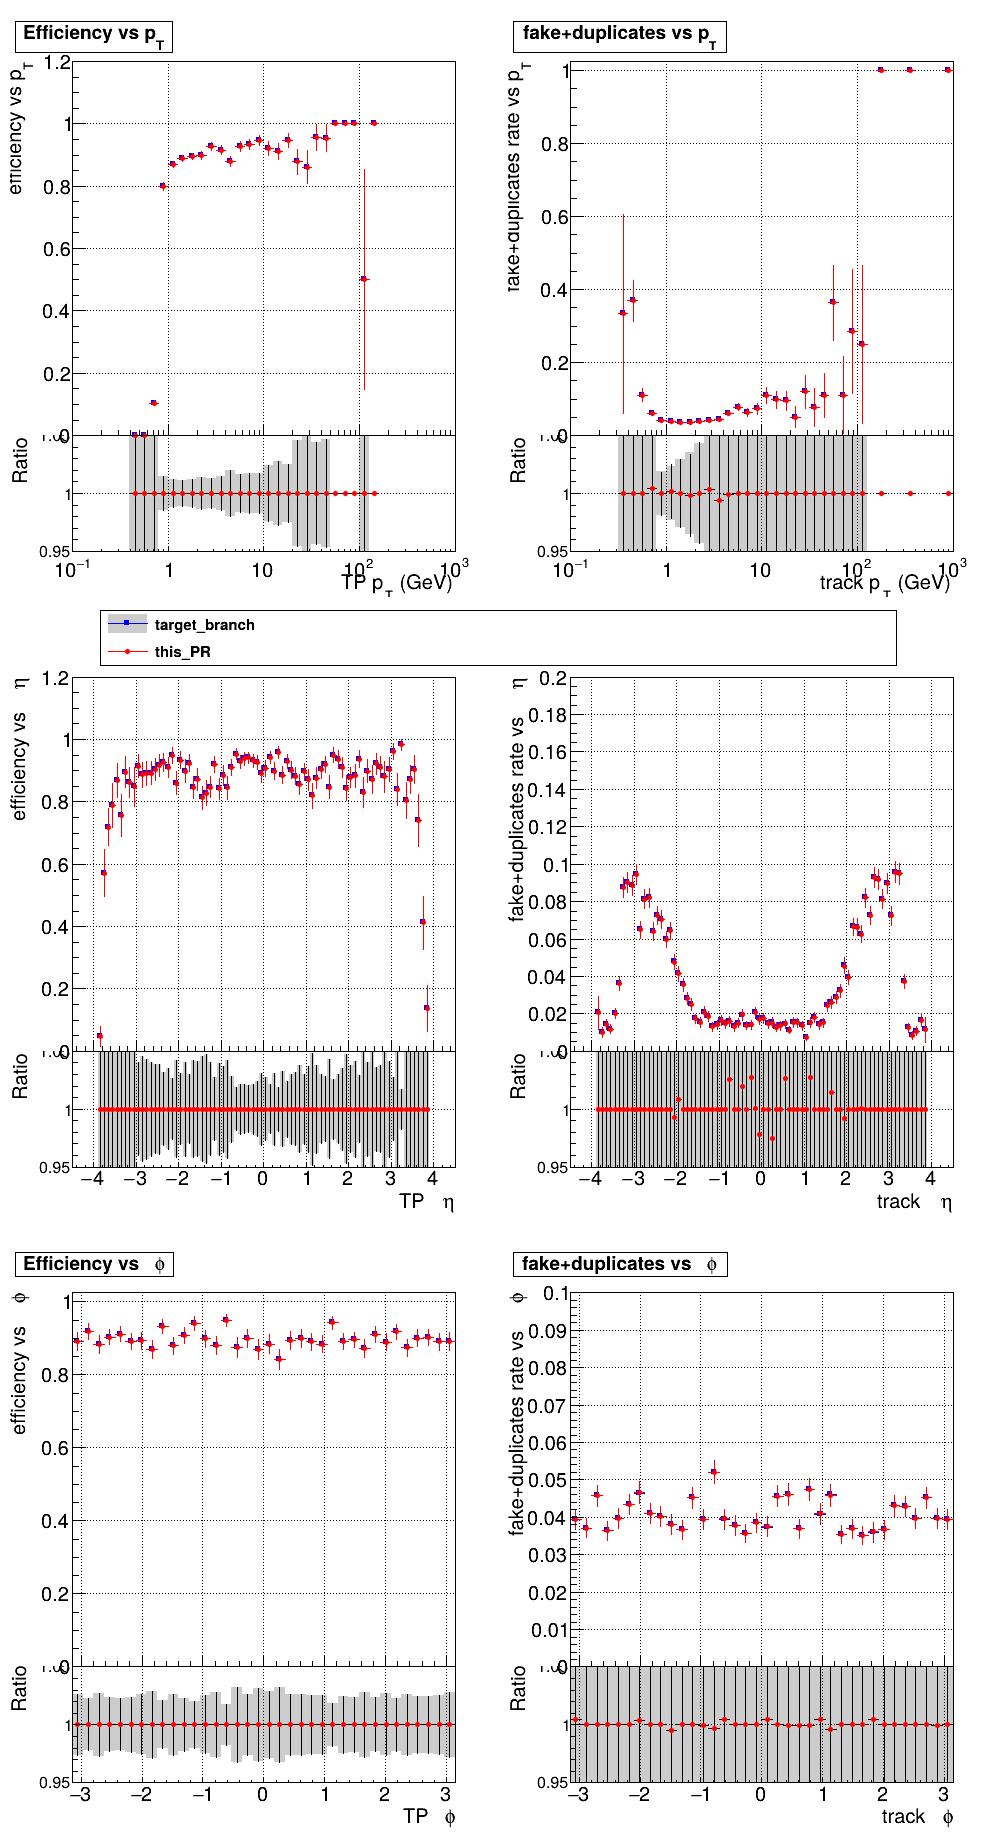
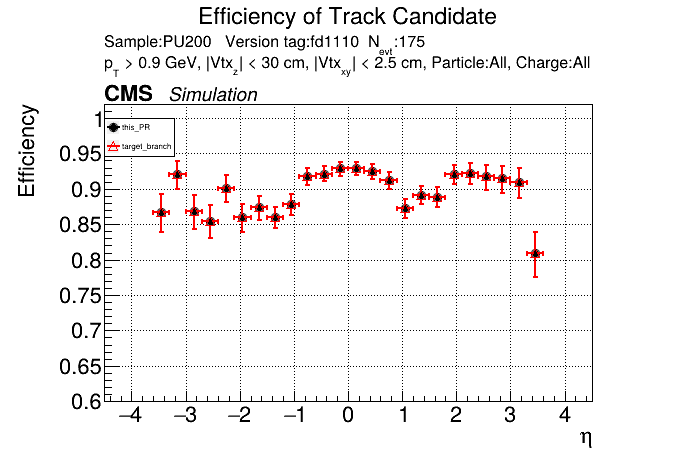
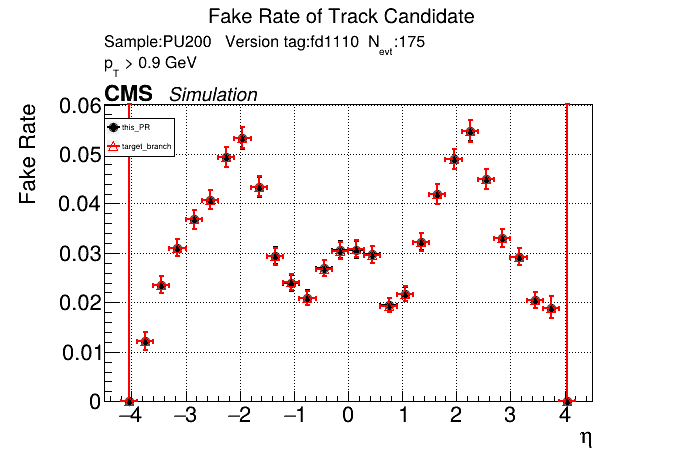
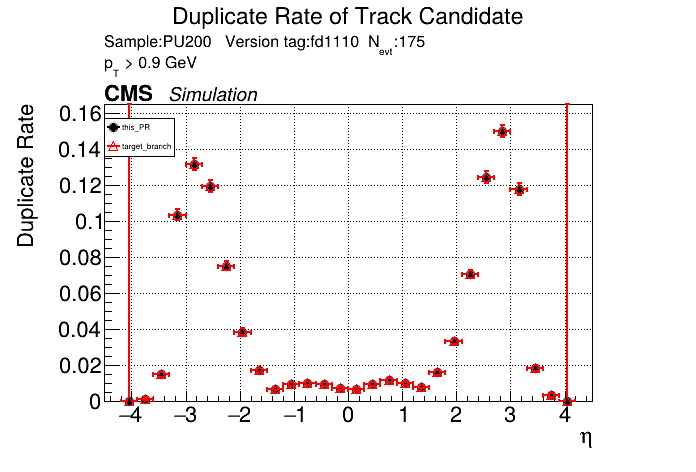
The PR was built and ran successfully in standalone mode. Here are some of the comparison plots.
The full set of validation and comparison plots can be found here. Here is a timing comparison: |

|
was there a feature change in this PR in the algorithm ( I thought this was just ntuple-related) |
No, there was no change in the algorithm. There must be a bug somewhere (or some change in matching tolerance or something like that). The part that writes the ntuple was pretty much completely rewritten, so it would be better if @Hoobidoobidoo or @sgnoohc look into it since they would be more familiar with that. While rebasing it, nothing stood out to me that could cause this. |
|
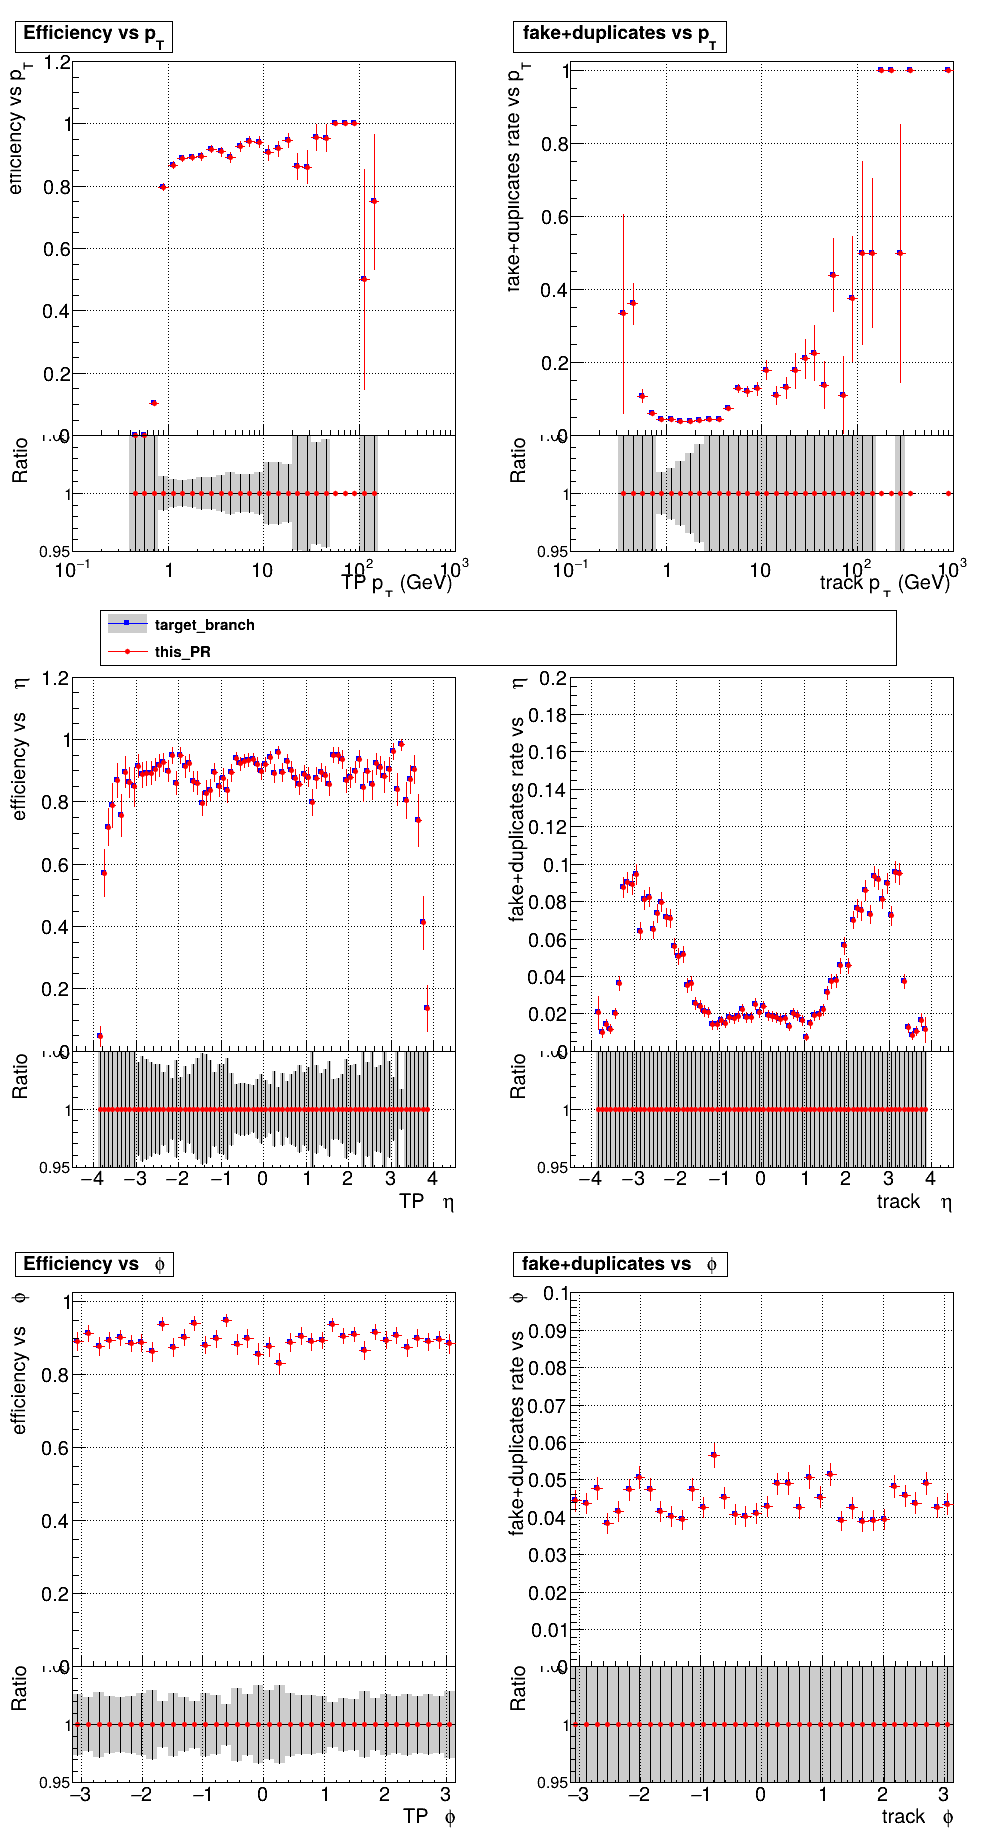
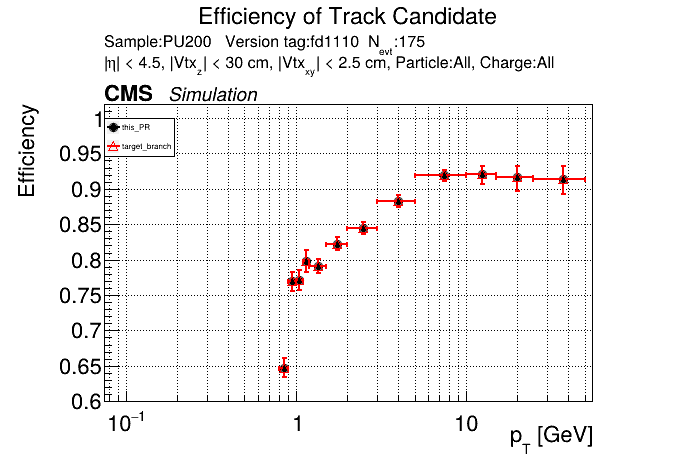
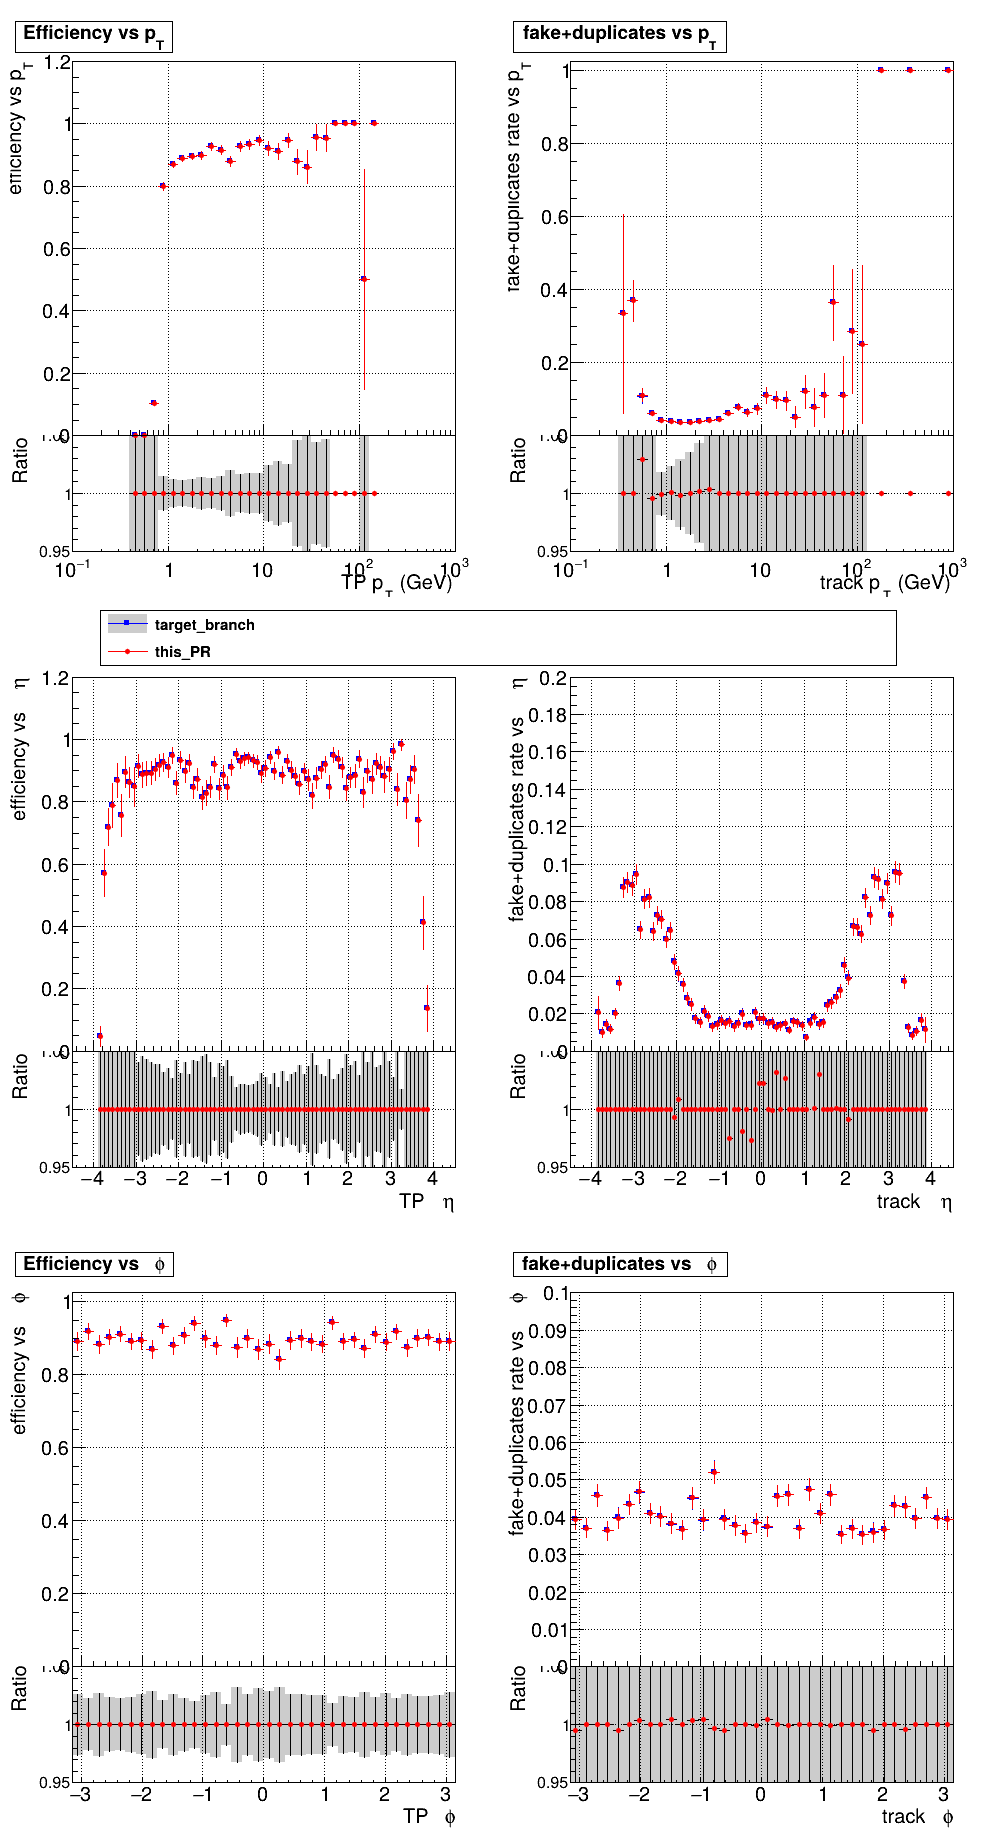
The PR was built and ran successfully with CMSSW. Here are some plots. OOTB All Tracks
The full set of validation and comparison plots can be found here. |

43311a5 to
72eb0d5
Compare
|
/run all |
|
There was a problem while building and running in standalone mode. The logs can be found here. |
72eb0d5 to
8c3792d
Compare
|
/run all |
|
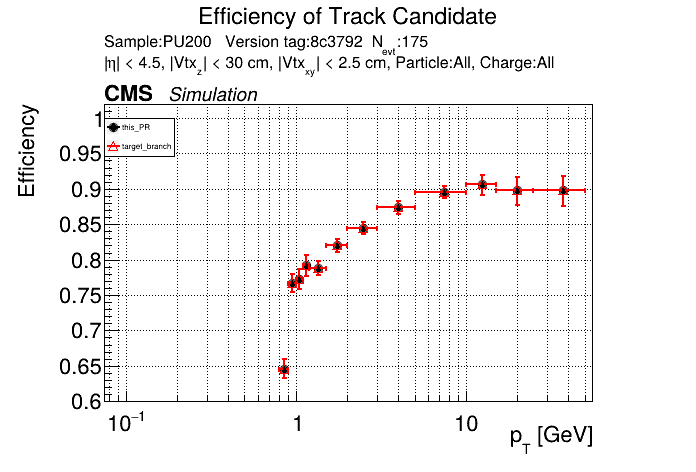
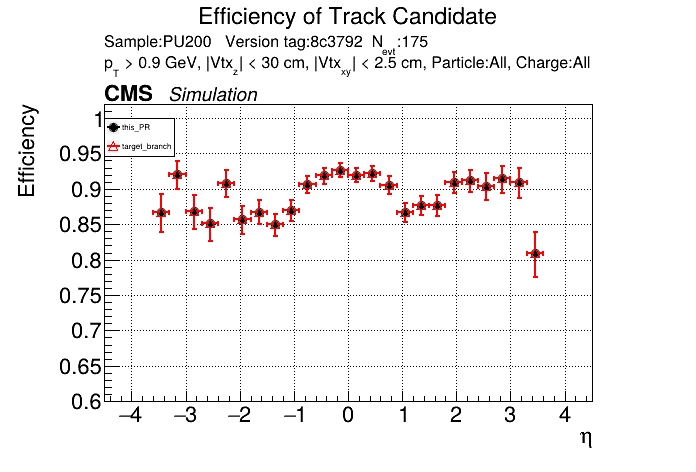
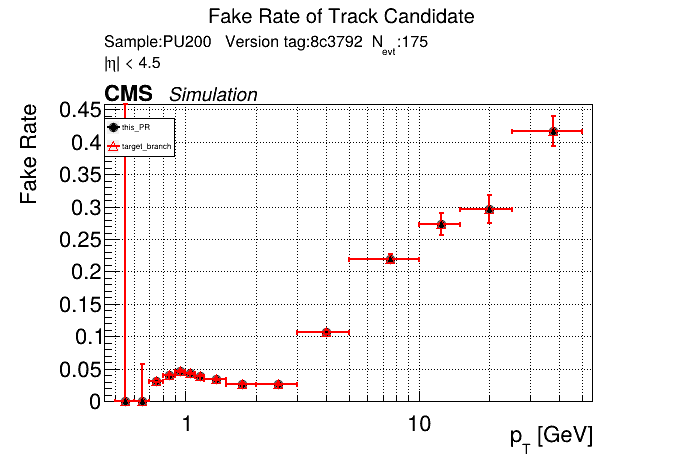
The PR was built and ran successfully in standalone mode. Here are some of the comparison plots.
The full set of validation and comparison plots can be found here. Here is a timing comparison: |
|
The plots look fairly reasonable now, but the timing is pretty wacky. I'll look into that |
|
The PR was built and ran successfully with CMSSW. Here are some plots. OOTB All Tracks
The full set of validation and comparison plots can be found here. |
8c3792d to
357dc9f
Compare
|
This is ready for review. I removed the unnecessary printout I mentioned above. Here is a timing comparison on cgpu-1. |
|
The cpu timings on cgpu-1 also look good. |
was this tested with |
a related question: is there a way to ask for it from the CI /run ...? |
|
my review of the /standalone changes was rather cursory. It would be good to understand what the impact is for the standard benchmark outputs. How much slower is the case with an ntuple when default the validation plots are made (and what is the file size increase in this case)? Same for the case with |
|
Thanks for all the comments, Slava!
No, but I'll leave timings with it enabled below.
No, but if it becomes a common need I can add that. In that case we should also add the option to
I'll also take a look. While rebasing I fixed some obvious things, but I didn't look at it very carefully.
That's right. I'll also run the timing comparison with writing enabled. I'll address some of the comments you left, but I'll refer the rest to @Hoobidoobidoo or @sgnoohc since they can better address them. Heres a timing comparison on GPU with |
|
The PR was built and ran successfully in standalone mode on GPU. Here are some of the comparison plots.
The full set of validation and comparison plots can be found here. Here is a timing comparison: |

|
is the GPU more costly now at high stream count or is there some stability issue on the CI side? (bottom is with this PR) |

|
Timing looks good on lnx4555 Previous master (re-ran just now) |


|
The PR was built and ran successfully with CMSSW on GPU. Here are some plots. OOTB All Tracks
The full set of validation and comparison plots can be found here. |
d94865f to
fd11107
Compare
|
I fixed the conflicts with master and squashed. I'll run the CI again and do some timing tests on cgpu-1 to make sure it was a fluke. /run gpu-all |
|
I'll have to look into this further because it seems to get stuck on event 129 when all outputs are enabled. |
|
The PR was built and ran successfully with CMSSW on GPU. Here are some plots. OOTB All Tracks
The full set of validation and comparison plots can be found here. |
|
The PR was built and ran successfully in standalone mode on GPU. Here are some of the comparison plots.
The full set of validation and comparison plots can be found here. Here is a timing comparison: |


|
I looked into it and it turns out that it's because filling the t3dnn branches hangs for a while for event 129 since there is one module with 2156 T3s. But the slowdown also happens on master, so it's not an issue here. Here's a timing comparison on cgpu-1 for the first 100 events of PU200. There is a noticeable slowdown even with the default outputs. Let me know if you think that more things should be toggled by a flag instead of being written by default. |
|
Where is the timing increase coming from? Are we storing more info into the standard ntuple, or is the code just slower? If it is the former, don't we have an -l flag that toggles saving low-level info in the ntuple? We could put the new branches for the low-level objects under that flag so we don't compute/store them by default. edit: Or just don’t have —allobj as the default, save only the final objects. |
|
The output ntuple is still more than 4 times larger, so that must be it. I'll see which branches could be put behind flags so that it doesn't save so much stuff by default. |
|
Hello, I was running this branch on the PU200RelVal sample on cgpu-1 using the CPU backend and after around 1 hour, the memory usage for the process was around 250GB. I killed it so the system wouldn't run OOM. It seems there might be a memory leak somewhere. |
|
Added some small comments, not sure if any are related to memory issue above. |
|
Thanks for catching those issues/typos, @GNiendorf! I'll go through the changes slowly to make sure there are no more surprises. @aashayarora were you running with |
I was running with the |
|
Hmm there does seem to be a memory leak. It also seems to already be present in master, but it is worse in this branch, probably because it's saving more stuff. I suspect that the issue is with rooutil. |
|
Actually, seems like the issue is with #168. I'll look into it. |
Co-authored-by: Philip Chang <[email protected]>
Co-authored-by: Hubert Pugzlys <[email protected]>
Co-authored-by: Gavin Niendorf <[email protected]>
fd11107 to
d0b375b
Compare
|
Okay, hopefully everything is good now. I fixed the issues Gavin pointed out, moved some extra branches behind flags, and fixed the memory leak. Here's the new timing for the standard outputs on cgpu-1. The ntuple is now only about 10% larger. /run gpu-all |
|
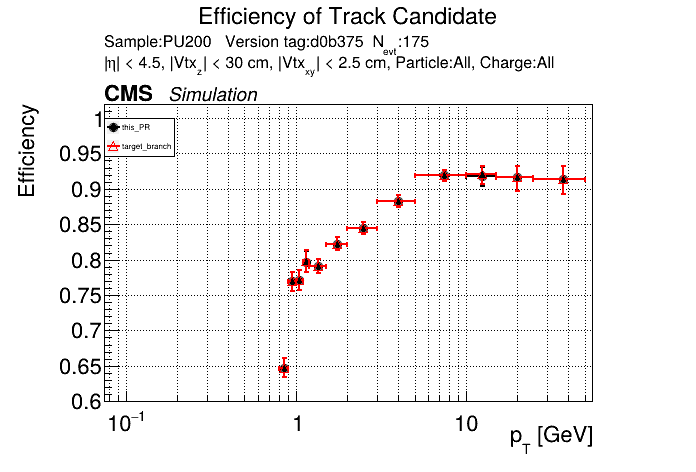
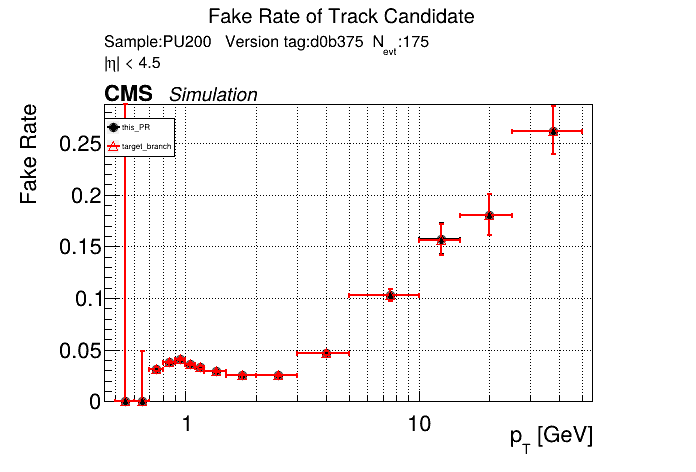
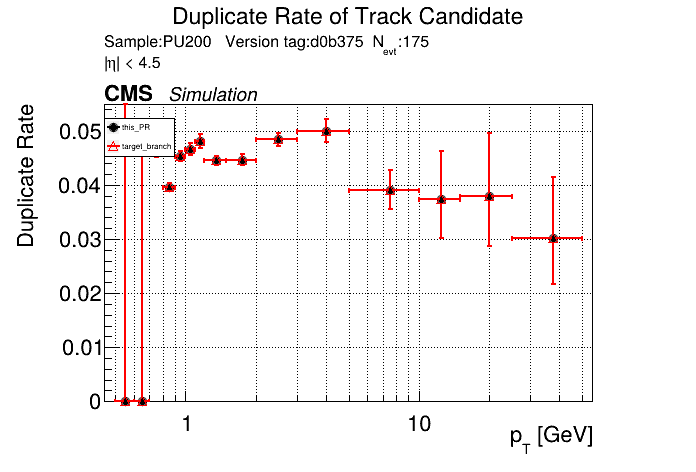
The PR was built and ran successfully with CMSSW on GPU. Here are some plots. OOTB All Tracks
The full set of validation and comparison plots can be found here. |
|
The PR was built and ran successfully in standalone mode on GPU. Here are some of the comparison plots.
The full set of validation and comparison plots can be found here. Here is a timing comparison: |


This is a rebase of SegmentLinking/TrackLooper#412.
It's a very large diff, so @Hoobidoobidoo will have to make sure that it's right. It should be a good starting point to finish the work, so I'll let @Hoobidoobidoo take over. I'm happy to answer questions or help with something if needed.