Mailserver Monitoring
The Mailserver ships with a comprehensive monitoring suite.
The suite is active by default but can be deactivated by setting METRICS=false in settings.env.
The suite uses stock Grafana and Prometheus containers and wires these up to the mailserver container. A Pushserver is included to allow the mailserver container to publish additional statistics from a script.
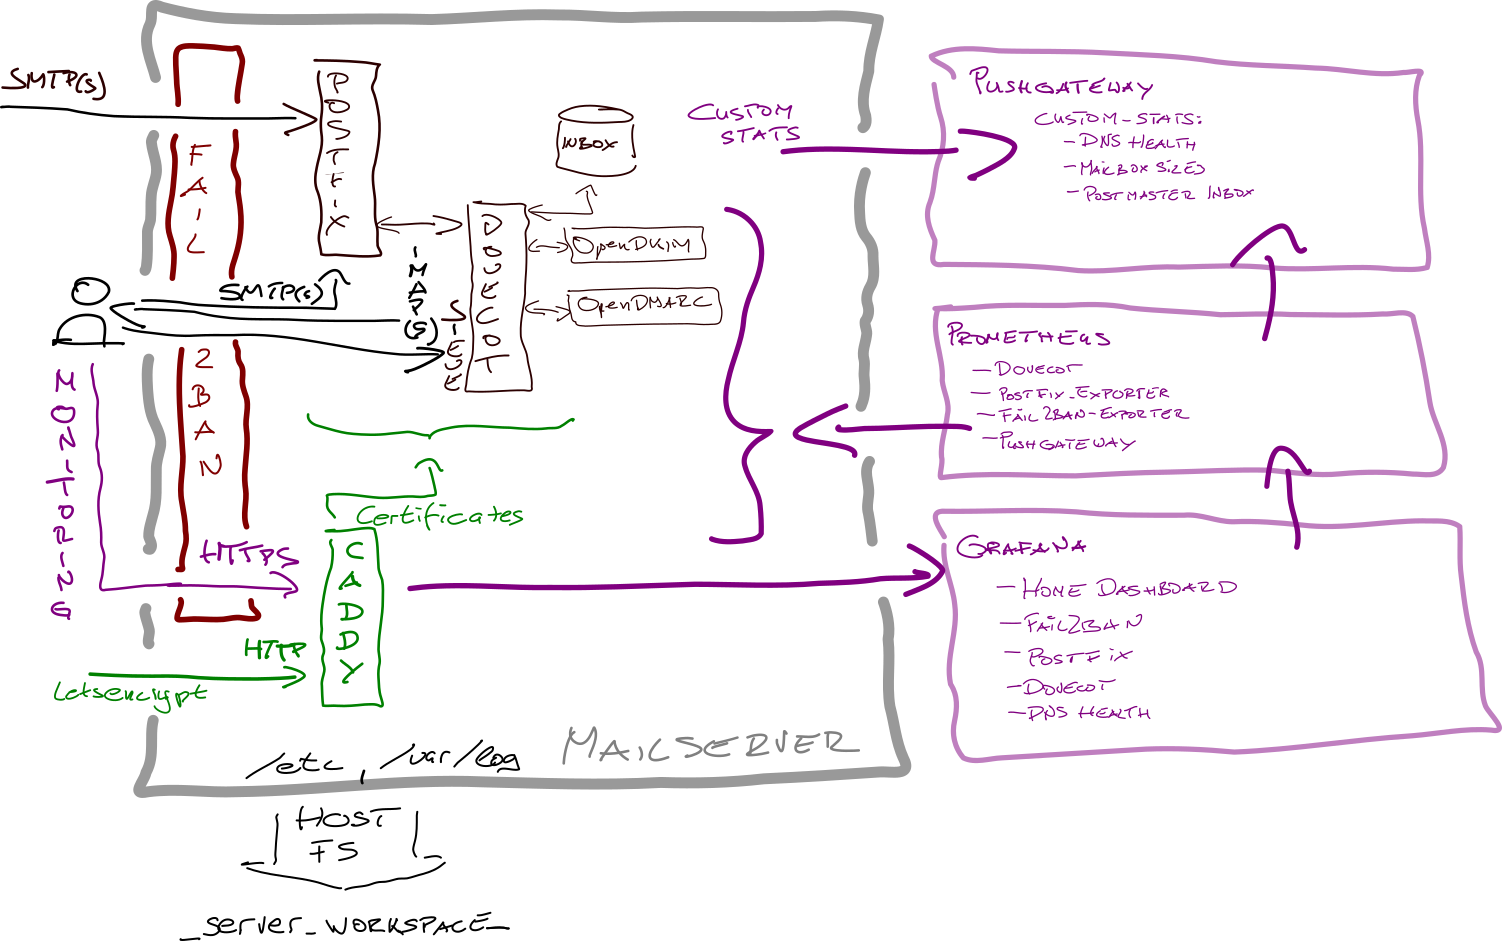
The monitoring containers only connect to a private network to access the mailserver metrics. Caddy, the HTTP server in the mailserver container, proxies HTTPS to Grafana. The monitoring containers are otherwise not internet accessible, nor can the containers access the internet.
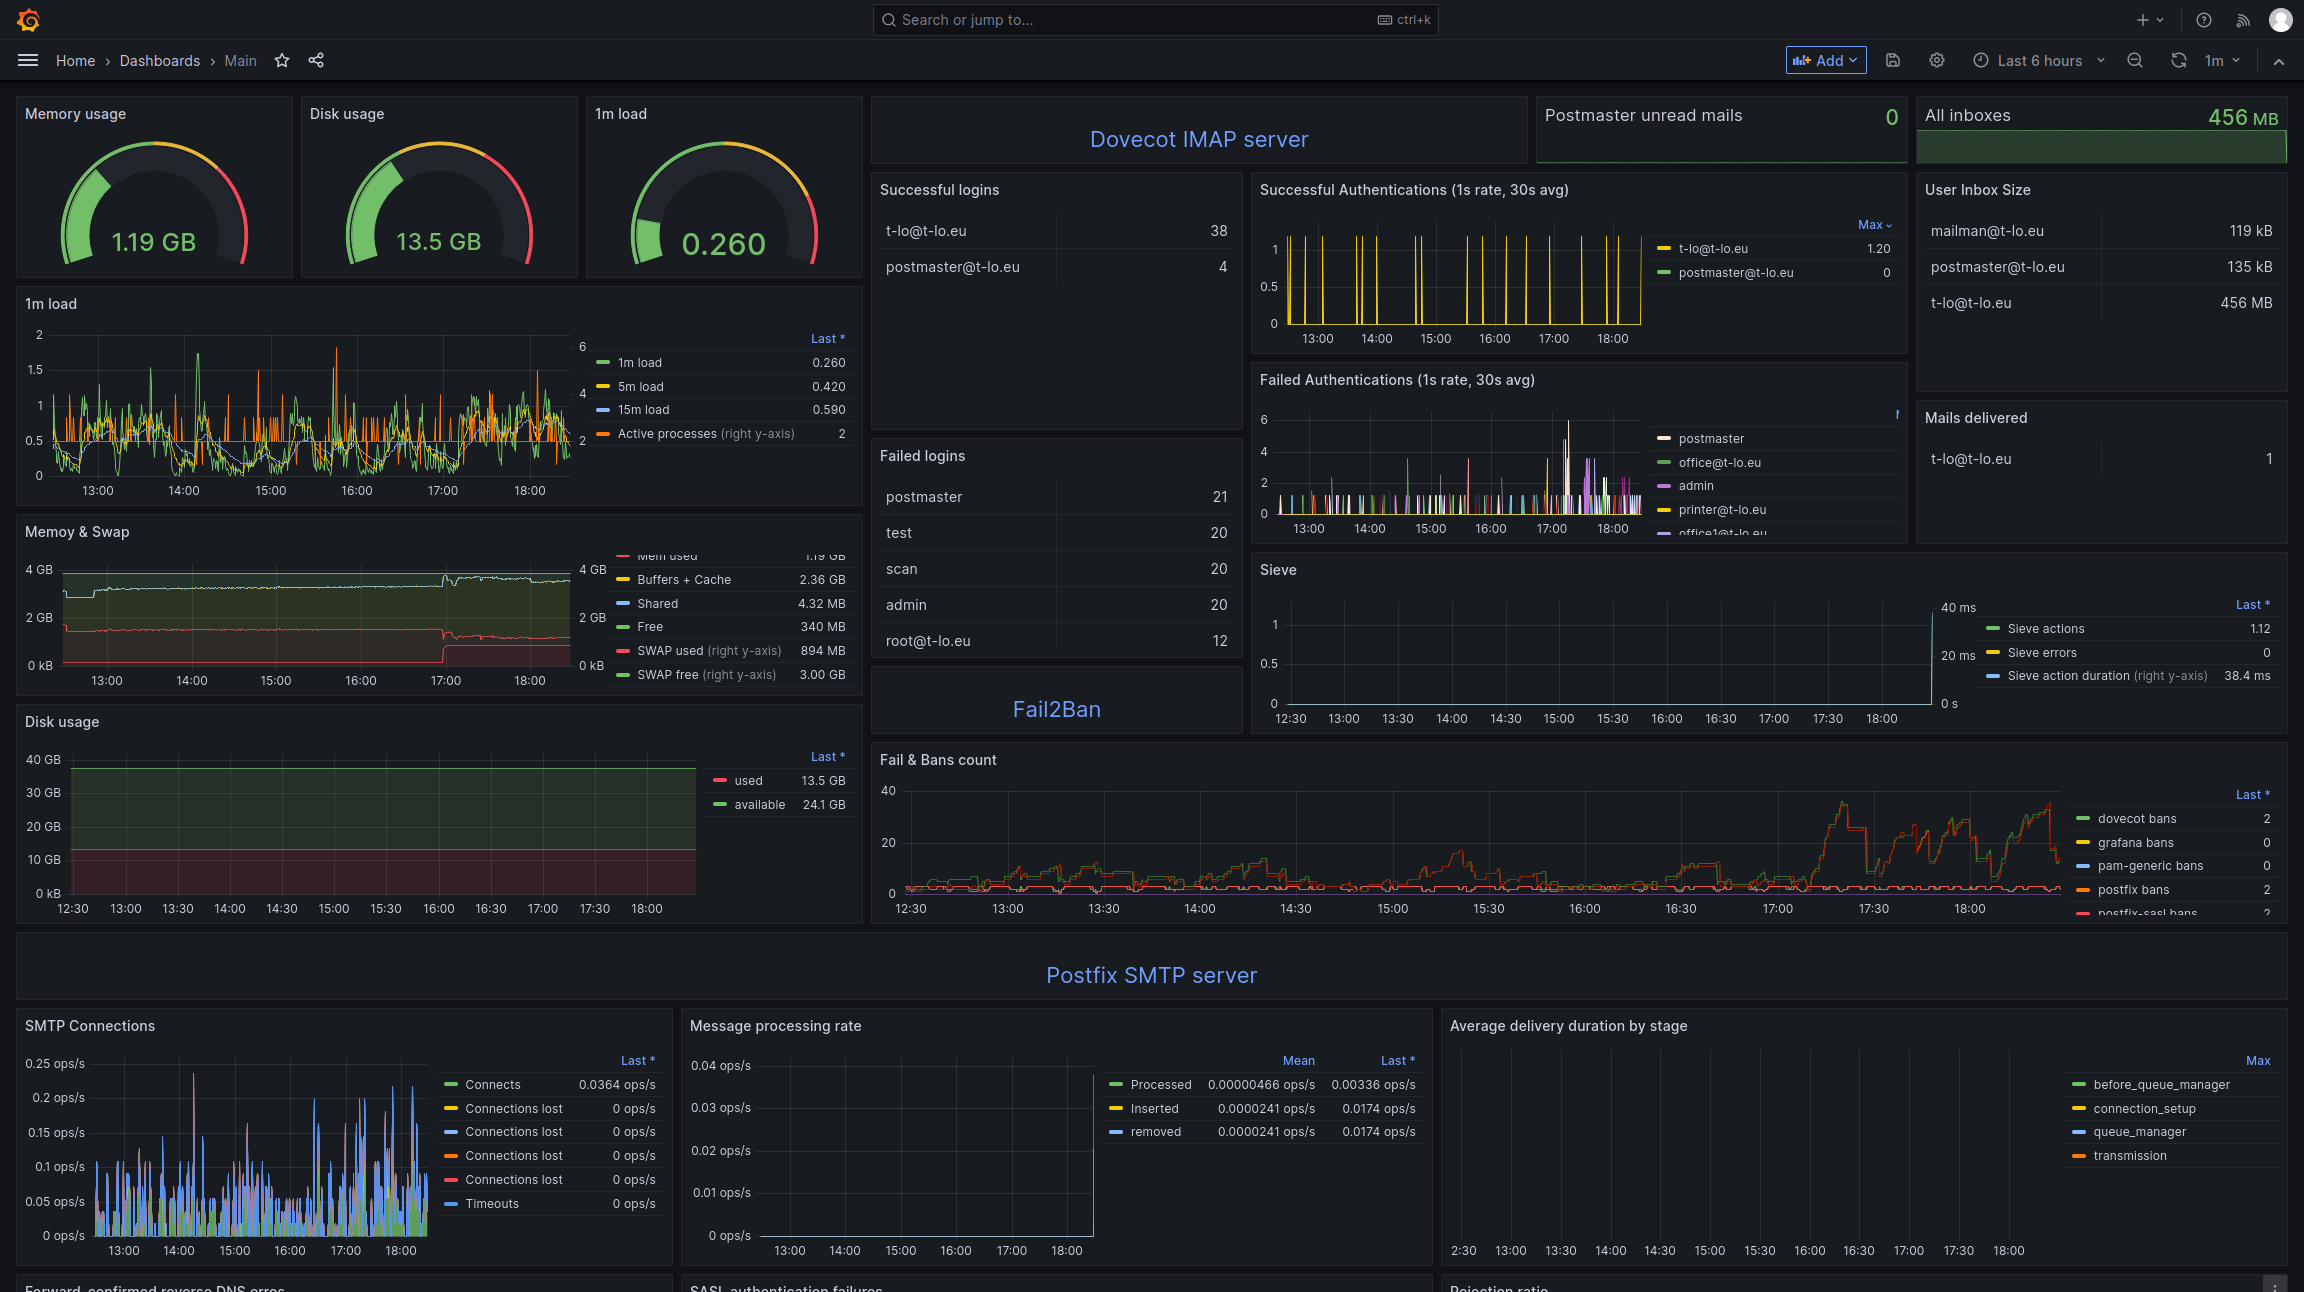
- A main dashboard with most important metrics from all service dashboards below
- SMTP server dashboard (Postfix)
- IMAP server dashboard (Dovecot)
- Fail2Ban dashboard
- Server DNS health dashboard w/ copy-paste-able text for creating SPF. DKIM, and DMARC text records
Grafana state is stored at _server_workspace_/var/lib/grafana/.
State is stored at _server_workspace_/prometheus-data and _server_workspace_/prometheus-pushgateway.
Dovecot statistics are scraped directly via Dovecot's built-in OpenMetrics server.
Postfix stats are provided via postfix_exporter, which runs inside the mailserver container if metrics are active.
Fail2ban metrics are published by fail2ban-prometheus-exporter which runs inside the mailserver container if metrics are active.
Some desirable statistics specific to the Mailserver set-up are exported by a custom script. The script does not provide a scrape endpoint; instead, data is published on the pushgateway.
Data includes:
- inbox sizes
- postmaster unread emails
- DNS health and SPF, DMARC, DKIM example entries for copy+pasting