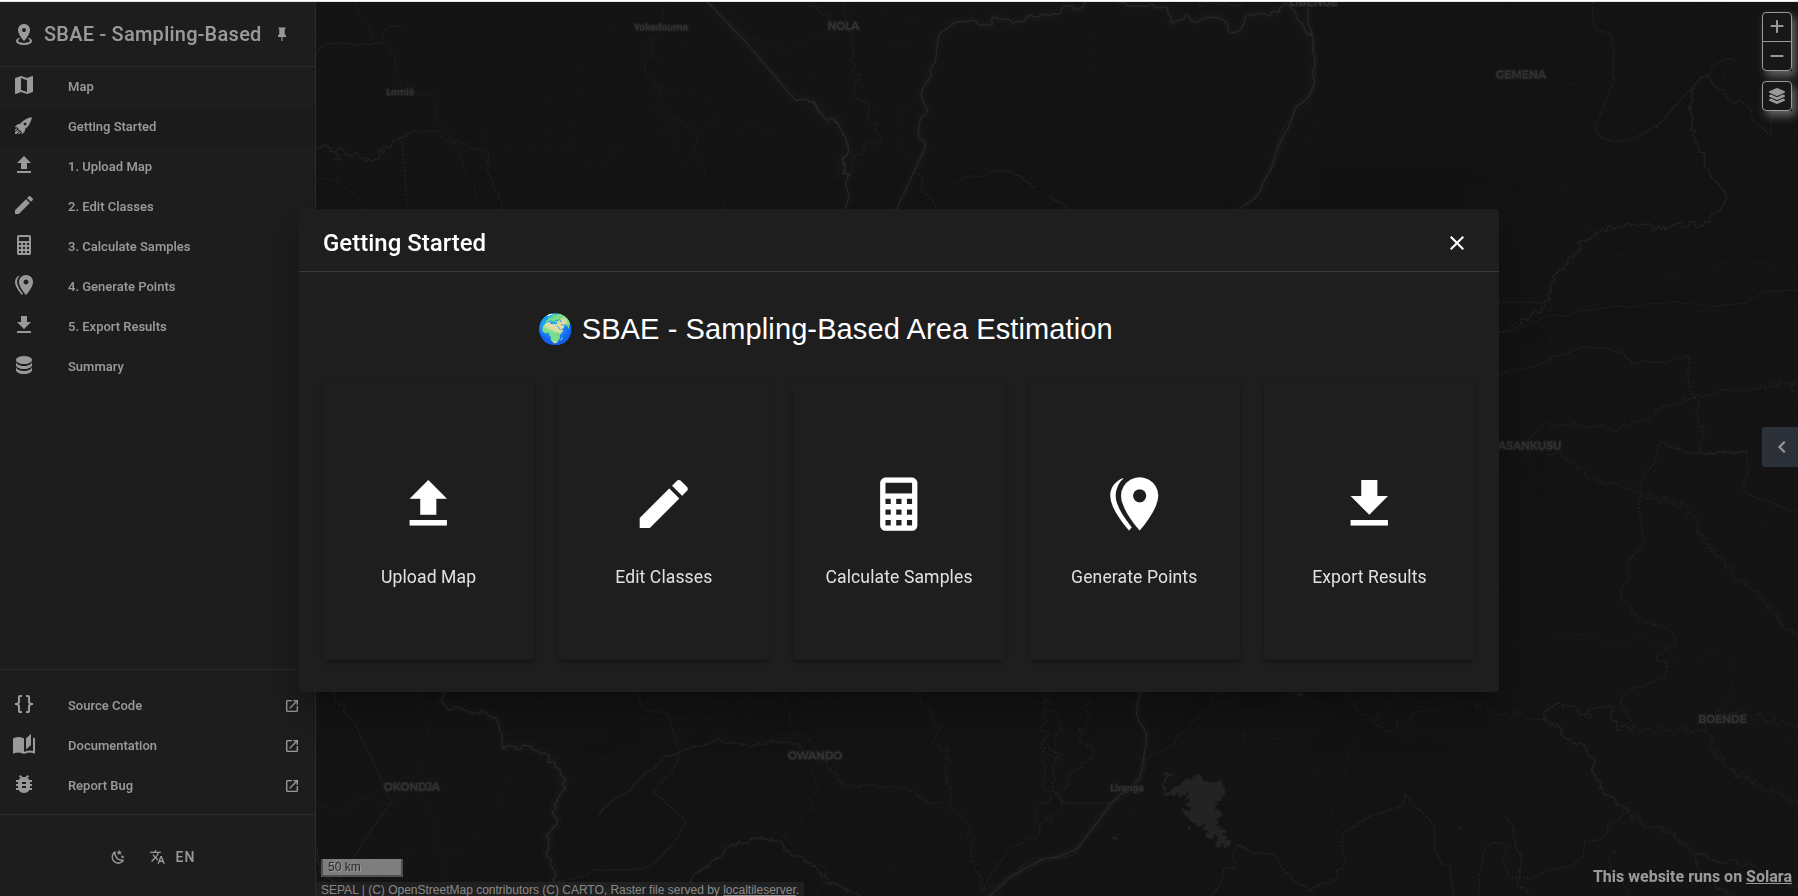
sbae-design is an interactive SEPAL-UI application for designing statistically sound area estimation and accuracy assessment sampling strategies for land monitoring. It is based on Pontus Olofsson, Giles M. Foody, Martin Herold, Stephen V. Stehman, Curtis E. Woodcock, Michael A. Wulder, Good practices for estimating area and assessing accuracy of land change, Remote Sensing of Environment, Volume 148, 2014, Pages 42-57, ISSN 0034-4257, https://doi.org/10.1016/j.rse.2014.02.015.
The app is designed to be a modernization and python version of the existing Stratified Area Estimation - Design module in SEPAL based on R Shiny.
It allows users to upload a map (raster or vector), calculate class areas, define sampling parameters based on overall accuracy or target class precision objectives, and generate sample points for subsequent analysis or collection. The application integrates an interactive map for visualizing the input map and the generated sample points.
- File Input: Supports common raster and vector geospatial file formats (e.g., GeoTIFF, Shapefile, GeoJSON).
- Area Computation: Automatically calculates the area for each class in the input map.
- Class Editing: Allows users to review and edit class names derived from the map.
- Expected User Accuracy Input: Facilitates Neyman allocation by allowing users to input expected user's accuracies for each class.
- Flexible Sample Design:
- Supports sample size calculation based on Overall Accuracy objectives.
- Supports sample size calculation based on Target Class Precision objectives.
- Allows selection of allocation methods: Proportional, Neyman, or Equal.
- Customizable parameters: target accuracy, allowable error, confidence level, minimum samples per class.
- Sample Point Generation: Generates geographically stratified random sample points based on the chosen design and allocation.
- Interactive Map Visualization:
- Displays the uploaded map (raster or vector) as an overlay.
- Visualizes generated sample points, color-coded by class, with informative popups.
- Includes standard map controls (zoom, scale, layers, fullscreen).
- Output Generation: Saves the generated sample points as CSV and GeoJSON files.
- Analysis (accuracy assessment): After designing a stratified sample and collecting reference data, the Analysis tab computes an error matrix, bias-adjusted area estimates with confidence intervals (Olofsson et al. 2014), and user's/producer's/overall accuracy. It reuses the classification areas from the design step as strata, or accepts a separate area CSV. Confidence levels of 90/95/99% are supported. Collect Earth Online ingestion and accuracy standard errors are planned for a later release.
- SEPAL-UI Integration: Built using
sepal-uifor a seamless experience within the SEPAL environment.
- Access to a SEPAL account and environment.
- The following Python libraries (and their dependencies) should be available in your SEPAL environment. The application checks for these and prints warnings if they are missing:
ipyvuetifysepal_uipandasnumpyipywidgetsipyleafletrasterio(for raster map processing)geopandas&shapely(for vector map processing and GeoJSON output)pyproj(for CRS handling and reprojections)scipy(for more accurate Z-score calculations for confidence levels other than 90/95/99%)matplotlib(for color generation and raster display rendering)Pillow(PIL - potentially used by matplotlib for image operations)
This application is designed to be run as an APP within the SEPAL environment. Follow instructions here: https://docs.sepal.io/en/latest/modules/index.html
The application interface is organized into a three-step stepper:
Step 1: Select File & Load
- Use the "Select Map File" input to choose your geospatial map file (e.g., a classification raster or a vector file with class polygons).
- Click the "Load File, Compute Area & Display Map" button.
- The application will:
- Attempt to load the file and compute the area of each class.
- Display the loaded map as an overlay on an interactive map.
- An alert will indicate success or any errors.
- If successful, you will be automatically moved to Step 2.
Step 2: Edit Classes & Accuracy
- Review Class Names: A list of map codes and their corresponding class names (initially derived from the map or set to the map code) will be displayed. You can edit these names in the text fields for clarity in your outputs.
- Set Expected User's Accuracies: For each class, adjust the slider to set the "Expected User's Accuracy." This value is primarily used if you select the "Neyman" allocation method in Step 3. The class name on the slider label will update dynamically as you edit it above.
- Click "Submit Classes & Proceed to Stage 3".
Step 3: Sample Design & Results
- A summary of your finalized classes and their areas will be shown.
- Set Sample Design Parameters:
- Calculation Objective: Choose between "Overall Accuracy" or "Target Class Precision."
- If "Target Class Precision" is selected:
- Choose the Target Class from the dropdown.
- Set the Target Class Allowable Error (Ej).
- Set the Target Overall Accuracy (OA) (if Overall Accuracy objective is chosen).
- Set the Allowable Error (Overall).
- Set the Confidence Level.
- Set the Min Samples per Class.
- Choose the Allocation Method (Proportional, Neyman, or Equal).
- Click "Calculate Sample & Generate Design".
- The application will calculate the required sample size and allocate samples per class.
- A summary table of the allocation will be displayed in the alert area.
- Sample points will be generated based on the design.
- Output files (
sample_points.csvandsample_points.geojson) will be saved in a subdirectory (e.g.,sae_design_[mapfilename]) within the same directory as your input map file. - Progress messages will appear in the alert area.
- Once points are generated, the "Show/Update Samples on Map" button will become active. Click it to display the generated sample points on the map below the parameters. Points are color-coded by class, and clicking on a point shows its details in a popup.
Configuration is primarily done through the UI widgets. The target CRS for output points is hardcoded to EPSG:4326.
- UI Framework:
ipyvuetify(for Jupyter-based UI components) - SEPAL Integration:
sepal-ui(for SEPAL-specific widgets and model structure) - Mapping:
ipyleaflet(for interactive map display) - Core Processing:
pandas,numpy - Geospatial Libraries:
rasterio(for raster data I/O and processing)geopandas(for vector data I/O, processing, and GeoJSON output)shapely(for geometric operations, via geopandas)pyproj(for coordinate reference system transformations)
- Statistics:
scipy(for Z-score calculation) - Plotting/Visualization Utilities:
matplotlib(for color generation and rendering raster overlays) - Environment: Designed to run within a SEPAL JupyterLab environment.
This project is part of sepal-contrib. Contributions are generally welcome! If you'd like to help improve sbae-design:
- Check the
sepal-contrib/sbae-designrepository for existing issues or contribution guidelines. - If you have a new feature or bug fix:
- Fork the repository.
- Create a new branch for your changes (
git checkout -b feature/your-feature-name). - Make your changes and commit them with clear messages.
- Push your branch to your fork.
- Open a Pull Request against the
sepal-contrib/sbae-designrepository.
Please ensure your contributions align with the project's goals and coding style.
This project is licensed under the MIT open source license 
LICENSE file for details.
- For issues or questions regarding this specific application, please open an issue on the
sepal-contrib/sbae-designGitHub repository. - For general SEPAL queries, refer to the SEPAL platform documentation and support channels.