Visualise Normal distributed sample data with changing mean and std
Streamlit App: App Link
This Streamlit web app allows users to visualize and interact with normal distributions and Kernel Density Estimation (KDE). The app has two main pages:
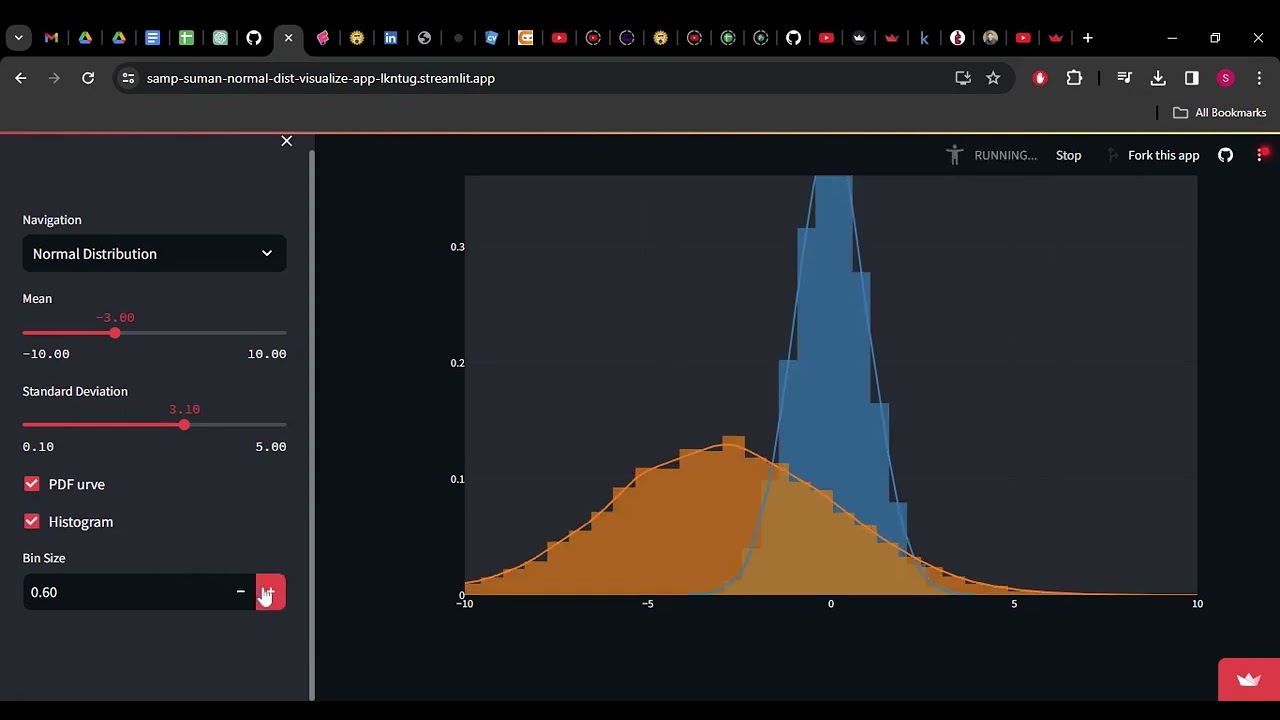
This page provides a visual representation of a normal distribution. Users can customize the distribution by adjusting parameters such as mean, standard deviation, bin size, and the option to show/hide the density curve.
- Adjust the mean and standard deviation sliders to modify the characteristics of the normal distribution.
- Use the bin size slider to control the granularity of the histogram.
- Toggle the "Show Density Curve" checkbox to display or hide the probability density function (PDF) curve.
This page is designed to assist teachers in explaining normal distribution concepts to beginners. Follow Session 41 in DSMP Playlist CampusX
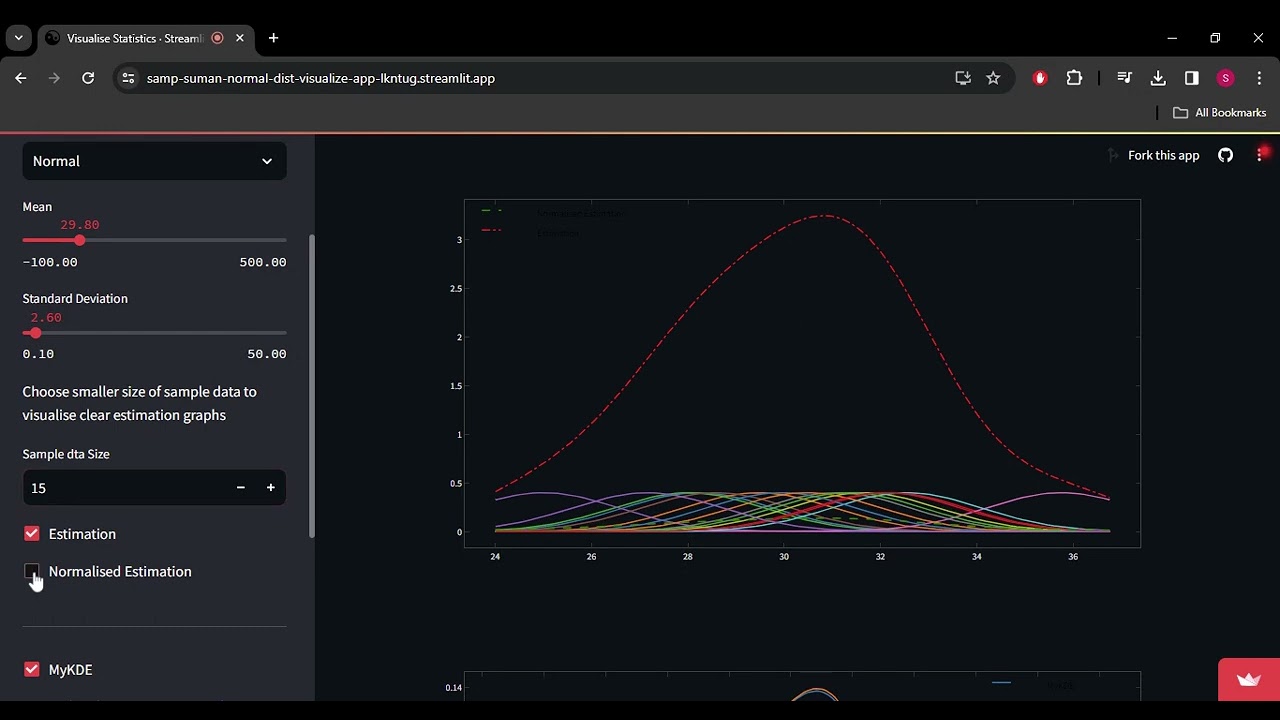
This section demonstrates Kernel Density Estimation from scratch, allowing users to choose the bandwidth for the KDE. Bandwidth options include Scott, Silverman, or a custom value.
- Select the "MyKDE" option for KDE from Scratch.
- Choose the bandwidth type (Scott, Silverman, or Other).
- If "Other" is selected, input a custom bandwidth value.
- Explore the visual representation of the KDE.
- Visualization using the Seaborn library to perform Kernel Density Estimation.
- Select the "Seaborn" option.
- Observe the KDE plot generated by Seaborn.
Follow Session 40 in DSMP Playlist CampusX
- Special thanks to Nitish Sir.
- Inspired by the need to visualize and teach normal distribution and KDE concepts.