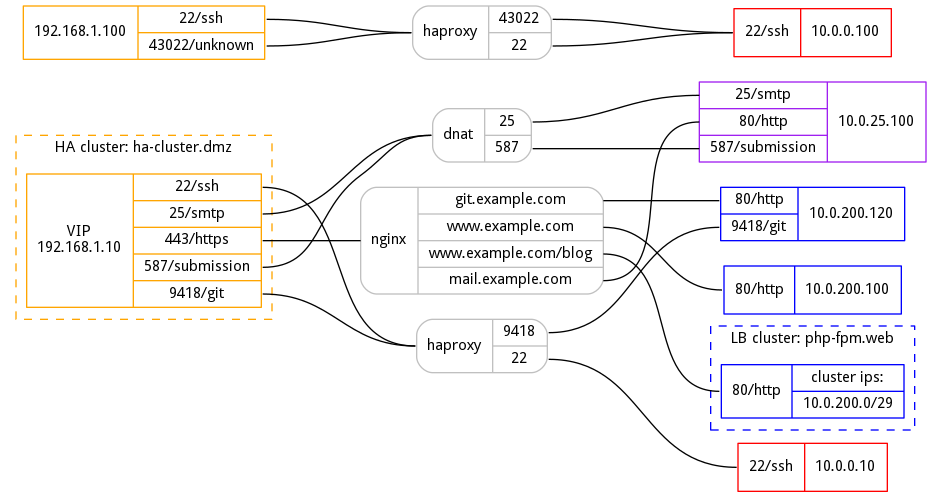
This is a useful little tool that will generate a nice graphviz graph illustrating your reverse proxy flow. It takes a manually curated YAML file describing the topology of your network, proxy definitions, and optionally a collection of nmap output files for additional port/service information and output a graph in any format supported by graphviz.
When run with --help:
usage: rev-proxy-grapher.py [-h] --topology TOPOLOGY [--resolve-dns]
                            [--nmap-xml NMAP_XML [NMAP_XML ...]]
                            [--limit-ext LIMIT_EXT [LIMIT_EXT ...]]
                            [--font FONT] [--fontsize FONTSIZE]
                            [--ranksep RANKSEP] [--out OUT] [--verbose]

Draw a nice graph of your external to internal proxies

optional arguments:
  -h, --help            show this help message and exit
  --topology TOPOLOGY   File describing the proxies and the topology of your
                        networks (default: topology.yaml)
  --resolve-dns         Attempt to resolve DNS for all IPs (default: False)
  --nmap-xml NMAP_XML [NMAP_XML ...]
                        Get additional node details from these nmap XML scan
                        files (default: ())
  --limit-ext LIMIT_EXT [LIMIT_EXT ...]
                        Only include these source IPs or networks (default:
                        ())
  --font FONT           Font to use in the graph (default: droid sans,dejavu
                        sans,helvetica)
  --fontsize FONTSIZE   Font size to use in the graph (default: 11)
  --ranksep RANKSEP     Node separation between columns (default: 1)
  --out OUT             Write graph into this file, guessing the output format
                        by extension (default: graph.png)
  --verbose             Be more verbose (default: False)
- python3-pydotplus
- python3-PyYAML
- python3-netaddr
See output of --help, and examples in the examples directory. To generate an example graph of your own, simply run:
rev-proxy-grapher.py --topology examples/topology.yaml
This will generate graph.png if everything worked well.
If you want to see what is added by running nmap:
rev-proxy-grapher.py \
    --topology examples/topology.yaml \
    --nmap-xml examples/nmap-external.xml \
    --out graph-with-nmap.svg
Currently, this only supports one level of proxying. For example you cannot define a haproxy->nginx->lb-cluster relationship, but this will hopefully be coming in the future, as we have a need to get that properly represented anyway.
- Konstantin Ryabitsev <[email protected]>