Skip to content

perf: reduce memory allocations in ProjectFile.findInsertSpot - #4322

Merged
dsyme merged 1 commit into
fsprojects:masterfrom
chinwobble:perf
Aug 25, 2026
Merged

dsyme merged 1 commit into
fsprojects:masterfrom
chinwobble:perf

Conversation

@chinwobble

@chinwobble chinwobble commented Feb 6, 2026 •

Copy link
Copy Markdown
Contributor

Context

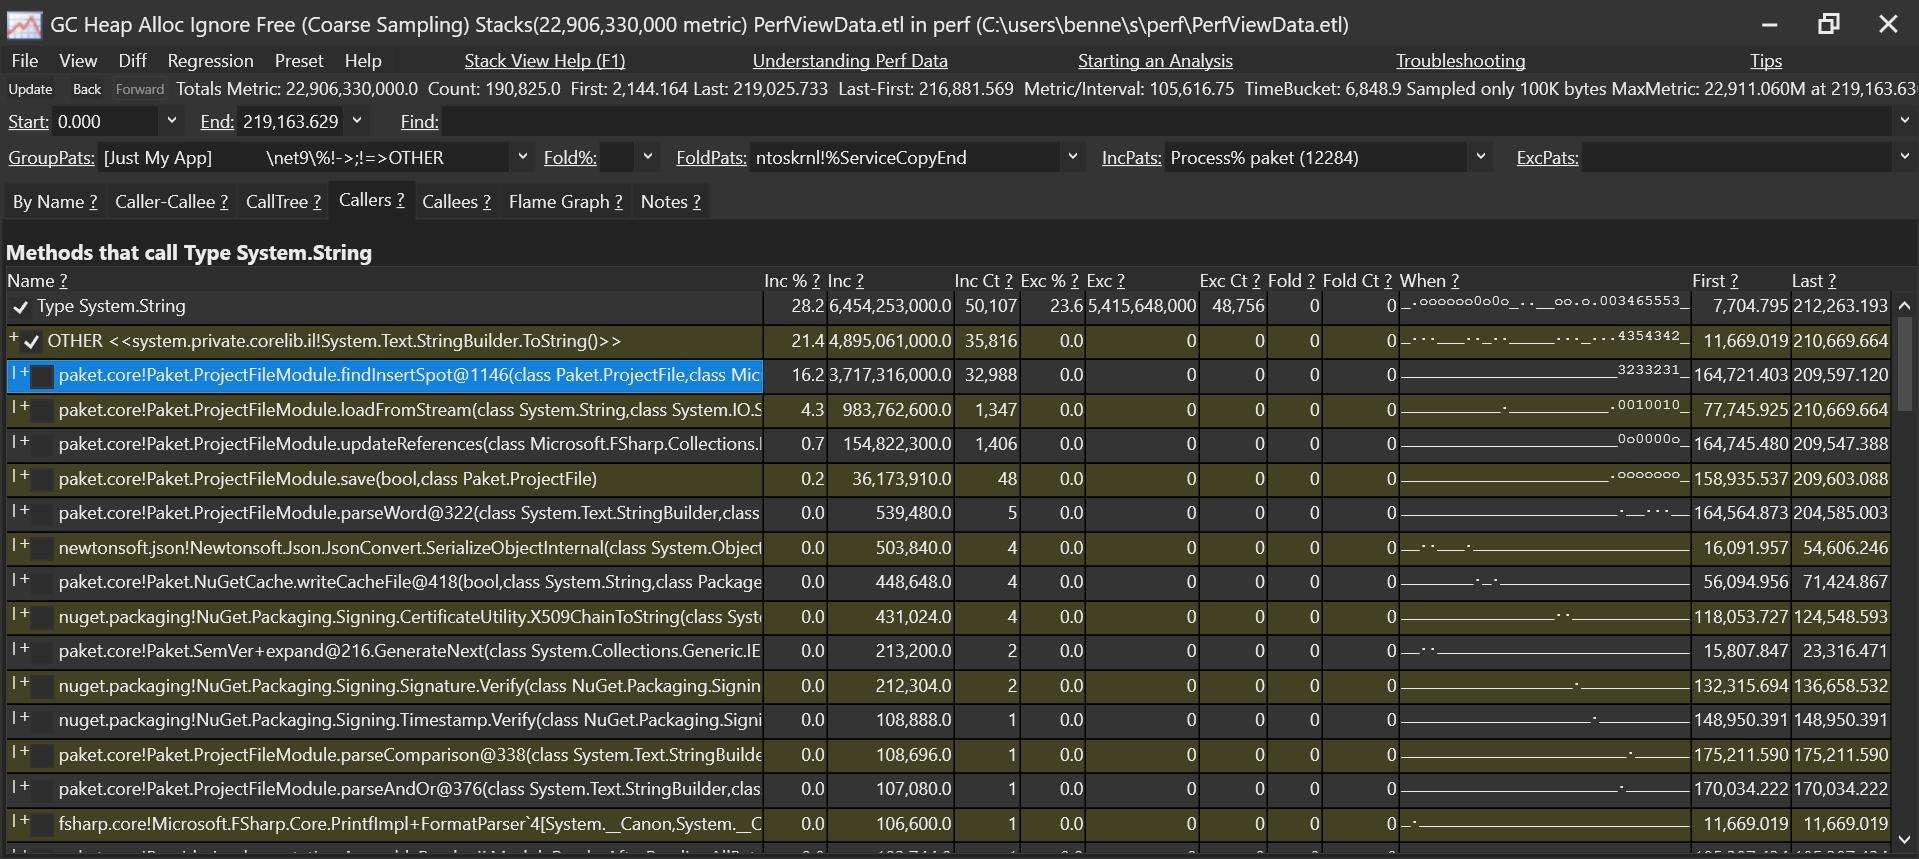
Perf analysis shows the function findInsertSpot shows allocates several gig of memory when running paket install on this repo.
image

The changes in this PR remove unnecessary calls to XmlNode.ToString() to reduce memory allocations to System.String and StringBuilder.

The results below show that total allocations is reduced by 8 GB.

Before GC Stats

Total CPU Time: 99,949 msec
Total GC CPU Time: 5,216 msec
Total Allocs : 22,922.339 MB
Number of Heaps: 1
GC CPU MSec/MB Alloc : 0.228 MSec/MB
Total GC Pause: 6,418.9 msec
% Time paused for Garbage Collection: 3.0%
% CPU Time spent Garbage Collecting: 5.2%
Max GC Heap Size: 240.740 MB
Peak Process Working Set: 398.725 MB
Peak Virtual Memory Usage: 2,481,102.819 MB

After GC Stats

Total CPU Time: 62,869 msec
Total GC CPU Time: 4,305 msec
Total Allocs : 14,944.830 MB
Number of Heaps: 1
GC CPU MSec/MB Alloc : 0.288 MSec/MB
Total GC Pause: 5,261.2 msec
% Time paused for Garbage Collection: 4.8%
% CPU Time spent Garbage Collecting: 6.8%
Max GC Heap Size: 209.375 MB
Peak Process Working Set: 344.039 MB
Peak Virtual Memory Usage: 2,481,072.738 MB

@chinwobble
chinwobble marked this pull request as ready for review February 11, 2026 10:22
@chinwobble

Copy link
Copy Markdown
Contributor Author

@forki are you able to review this PR?

@dsyme

dsyme commented Aug 24, 2026

Copy link
Copy Markdown
Contributor

/repo-assist review this PR and respond with a comment

@github-actions

github-actions Bot commented Aug 24, 2026 •

Copy link
Copy Markdown
Contributor

✗ Repo Assist encountered failed, see workflow run.

Warning

Threat Detection Engine Failure — The analysis engine could not complete. This is a tooling failure, not a security finding.

What happened

The threat detection engine failed to produce results.

Review the workflow run logs for details.

Generated by 🌈 Repo Assist, see workflow run. Learn more.

@dsyme

dsyme commented Aug 25, 2026

Copy link
Copy Markdown
Contributor

/repo-assist review this PR and respond with a comment

@github-actions

github-actions Bot commented Aug 25, 2026 •

Copy link
Copy Markdown
Contributor

✓ Repo Assist completed successfully, see workflow run.

Generated by 🌈 Repo Assist, see workflow run. Learn more.

@github-actions

Copy link
Copy Markdown
Contributor

🤖 This is an automated response from Repo Assist.

I reviewed this PR's diff (findInsertSpot in ProjectFile.fs). Overall this looks like a solid, well-targeted perf fix:

  • Root cause correctly identified: the original loops called .OuterXml.ToString() on every child node just to check a string prefix ("<import", "<PropertyGroup"), which is expensive since OuterXml serializes the whole subtree. Doing this for every node in every project scanned explains the multi-GB allocations shown in the profiler.
  • Fix is sound: replacing the OuterXml prefix checks with Name.Equals(..., StringComparison.OrdinalIgnoreCase) avoids the serialization entirely for the common case, and OuterXml is now only computed when the node is actually an Import element (where the label/paket substring checks are still needed).
  • Control flow refactor (loop with if/elif/continueLooping instead of a compound boolean while condition) is a bit more verbose but preserves the original short-circuit semantics: stop on the first node that is neither a matching PropertyGroup nor a non-paket Import. I traced through it and it looks equivalent to the original.
  • The reported GC stats (22.9 GB → 14.9 GB total allocations, ~37% CPU time reduction) are a meaningful, measurable win, and the change is narrowly scoped to this one function plus a trivial whitespace fix elsewhere.

One minor suggestion for the author (non-blocking): the two-line whitespace-only change near AppendChild on AutoGenerateBindingRedirects is unrelated to the perf fix — could be dropped to keep the diff minimal, though it's harmless either way.

No functional concerns from my read of the diff. This looks ready for a maintainer's review/merge decision.

Generated by 🌈 Repo Assist, see workflow run. Learn more.
Comment /repo-assist to run again

Add this agentic workflow to your repo

To install this agentic workflow, run

gh aw add githubnext/agentics/workflows/repo-assist.md@ae8d551f07c7ed7619f8c58c7bb4c3ac89395d38

Sign up for free to join this conversation on GitHub. Already have an account? Sign in to comment

Projects

None yet

Development

Successfully merging this pull request may close these issues.

2 participants