This will give you a basic and fully operational virtual machine running the Elastic Stack (ELK):
- Debian 8 (Jessie).
- Elasticsearch 5.0.0.
- Logstash 5.0.0.
- Kibana 5.0.0.
Tested under Windows 7, with VirtualBox 5.1.6 and Vagrant 1.8.6.
- First, you need to install VirtualBox and Vagrant.
- Create a new directory under VirtualBox's Default Machine Folder, and put this repo's files inside.
- [Optional] Edit
./Vagrantfileaccording to your needs (more memory, proxy settings, etc.). - Run
$> vagrant upform inside the created directory using your command line tool (grab a coffee, that'll take a while).
The machine should now be up and running. You can access it via SSH ([email protected]:2222) using the private key located at ./.vagrant/machines/default/virtualbox/private_key.
- In
/etc/elasticsearch/elasticsearch.yml, set the following properties:network.host: localhosthttp.port: 9200
- In
/etc/kibana/kibana.yml, set the following properties:server.port: 5601server.host: "<GUEST_IP_ADDRESS>"elasticsearch.url: "http://localhost:9200"
- Restart Elasticsearch and Kibana (something like
$> sudo /etc/init.d/elasticsearch restartor$> sudo systemctl restart kibana).
Make sure the stack is running smoothly:
-
Elasticsearch:
$> curl http://localhost:9200{ "name" : "cD69Sz0", "cluster_name" : "elasticsearch", "cluster_uuid" : "CBNeHXz4Q1C8SUNCnE5d6g", "version" : { "number" : "5.0.0", "build_hash" : "253032b", "build_date" : "2016-10-26T05:11:34.737Z", "build_snapshot" : false, "lucene_version" : "6.2.0" }, "tagline" : "You Know, for Search" }
-
Kibana: http://localhost:5601
Logs are available in /var/log/.
At this point, you're set. The stack is installed, but not yet flowing (check out the example below for a complete workflow).
Logstash is capable of fetching events from a wide range of sources. Let's try a simple case: reading entries from a local logfile (formatted with Monolog).
He're our file: $> more ~/sample.log
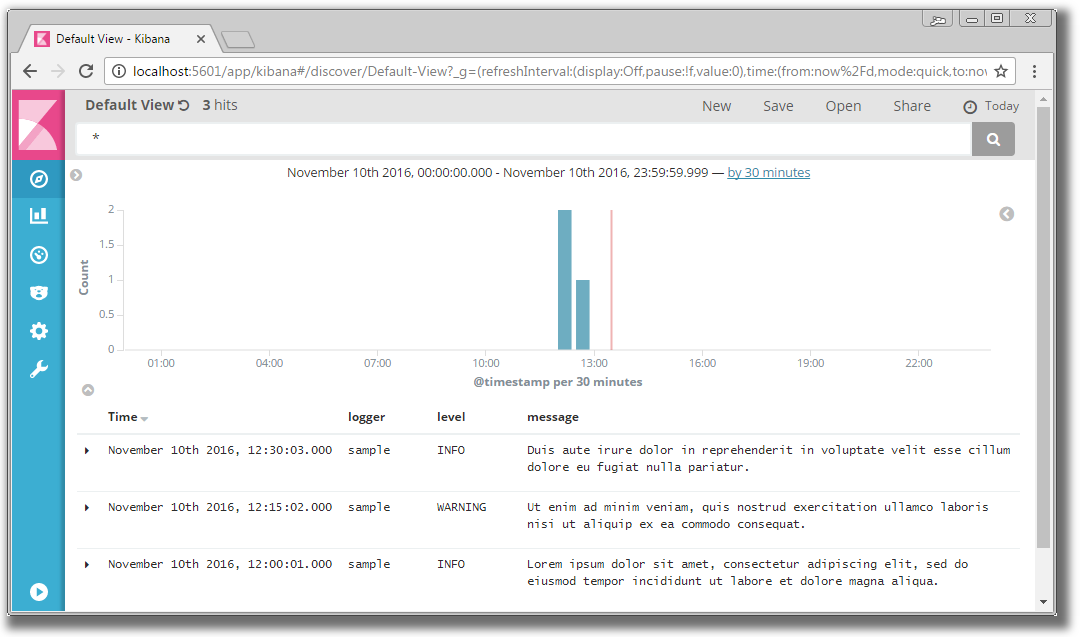
[2016-11-10 12:00:01] sample.INFO: Lorem ipsum dolor sit amet, consectetur adipiscing elit, sed do eiusmod tempor incididunt ut labore et dolore magna aliqua. [] []
[2016-11-10 12:15:02] sample.WARNING: Ut enim ad minim veniam, quis nostrud exercitation ullamco laboris nisi ut aliquip ex ea commodo consequat. [] []
[2016-11-10 12:30:03] sample.INFO: Duis aute irure dolor in reprehenderit in voluptate velit esse cillum dolore eu fugiat nulla pariatur. [] []
In order for Logstash to parse this file and structure it (but also to listen to any change that may occur on it), we must describe the complete pipeline in /etc/logstash/conf.d/sample.conf.
Restart Logstash, and then, on Kibana, create a new pattern to load our Elasticsearch index (logstash-sample). Finally, check out the Discovery section to see everything in place.