This repository comprises of R Code for Exploratory Data Analysis conducted on Bike Sharing Demand data set. The document also comprises of Linear Regression Model which is built to predict the rental bike count based on different features.
This project focuses on conducting Exploratory Data Analysis and running Linear Regression on Bike Sharing Demand data set which was provided by Hadi Fanaee Tork using data from Capital Bikeshare.
Bike sharing systems are a means of renting bicycles where the process of obtaining membership, rental, and bike return is automated via a network of kiosk locations throughout a city. Using these systems, people are able rent a bike from a one location and return it to a different place on an as-needed basis. Currently, there are over 500 bike-sharing programs around the world.
The main objective of this project is to explore and create a linear Regression Model so as to try to predict bike sharing demand.
The data set contains following features :- datetime - hourly date + timestamp season - 1 = spring, 2 = summer, 3 = fall, 4 = winter holiday - whether the day is considered a holiday workingday - whether the day is neither a weekend nor holiday weather - 1: Clear, Few clouds, Partly cloudy, Partly cloudy 2: Mist + Cloudy, Mist + Broken clouds, Mist + Few clouds, Mist 3: Light Snow, Light Rain + Thunderstorm + Scattered clouds, Light Rain + Scattered clouds 4: Heavy Rain + Ice Pallets + Thunderstorm + Mist, Snow + Fog
temp - temperature in Celsius atemp - “feels like” temperature in Celsius humidity - relative humidity windspeed - wind speed casual - number of non-registered user rentals initiated registered - number of registered user rentals initiated count - number of total rentals
We are trying to predict count variable i.e. number of total rentals which will be behaving as a dependent variable for our analysis.
First I will be conducting exploratory data analysis which is an essential step to undestand the data.
Scatter Plot to show the relationship between count (number of total rentals) and temp (temperature in Celsius)
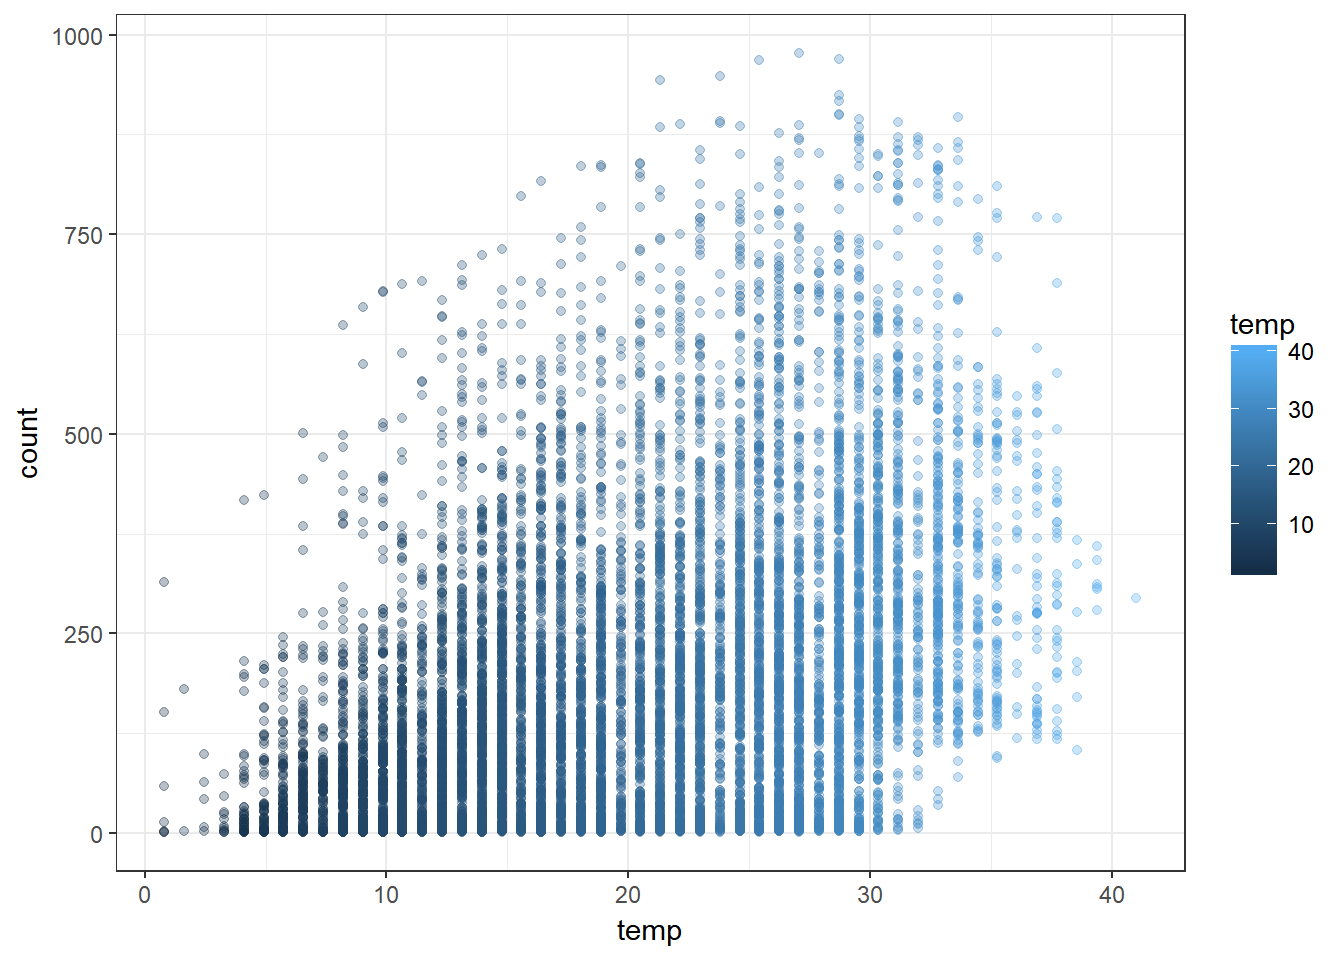
The above scatter plot shows that as the temperature increases the count i.e. the number of total rentals also increases.
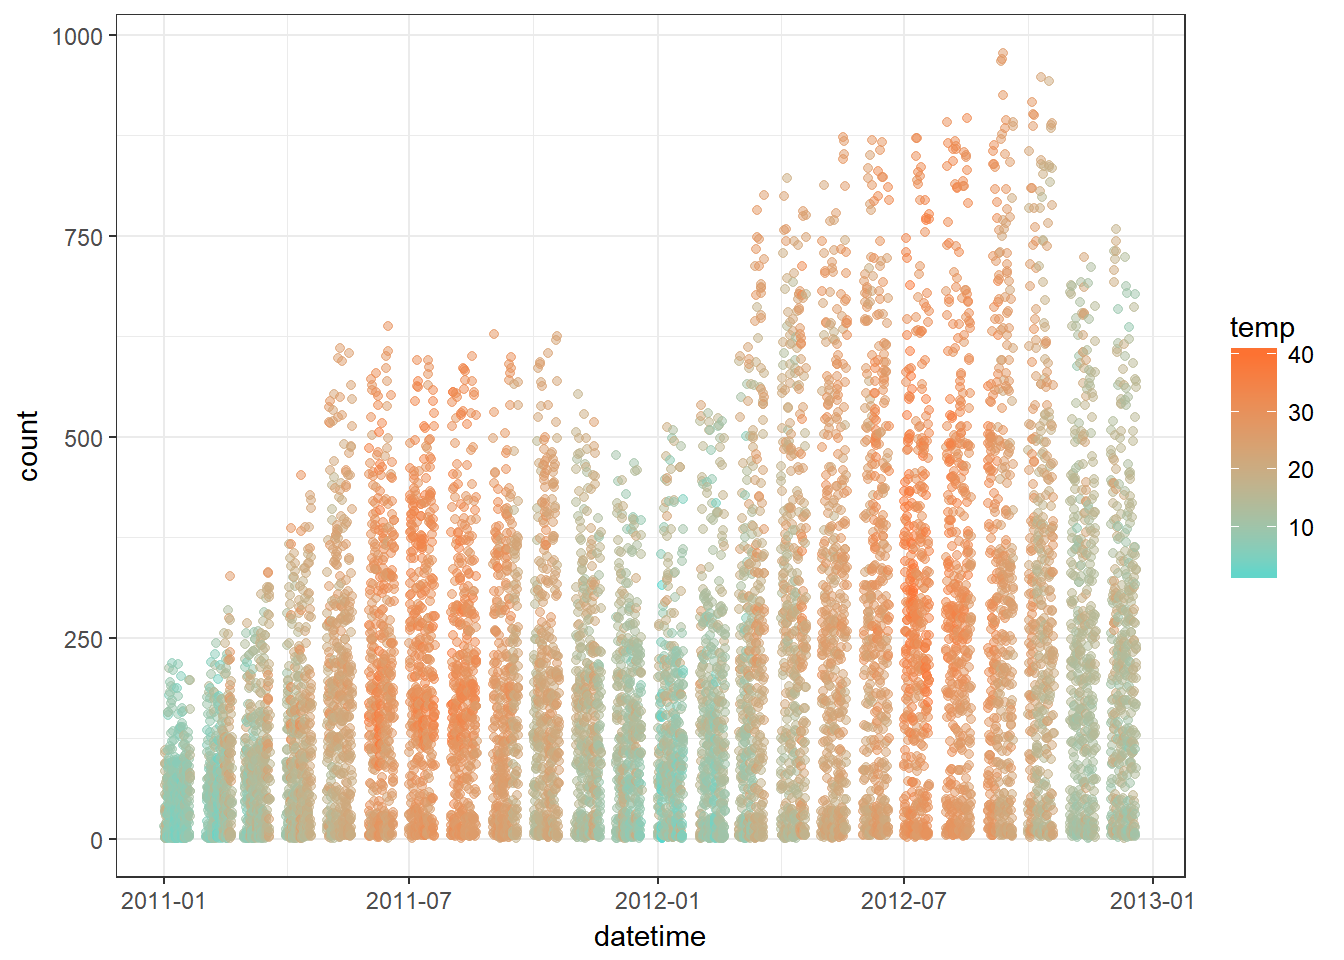
There is a clear seasonal trend where the total rental bikes seems to decrease during Winters i.e month of January and Feburary of the year and the total rental bikes seems to increase during summers. The other trend which is quite evident is that the number of rental bike counts is increasing from year 2011 to year 2013.
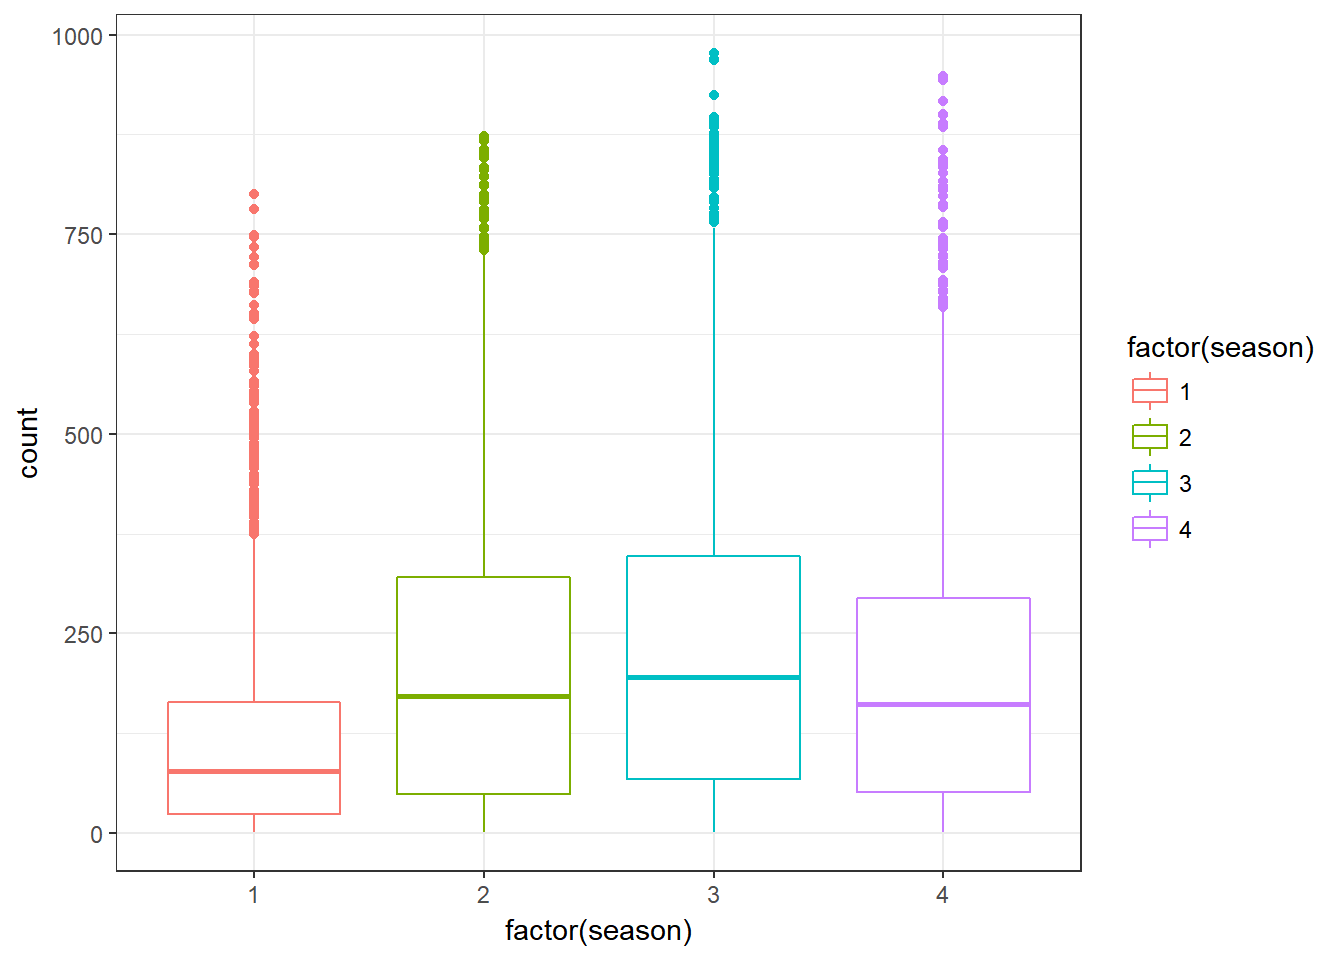
The box plot between the number of bike rentals and season shows that the line can not capture the non linear relationship and that there’s is more rentals in winter as compared to spring.
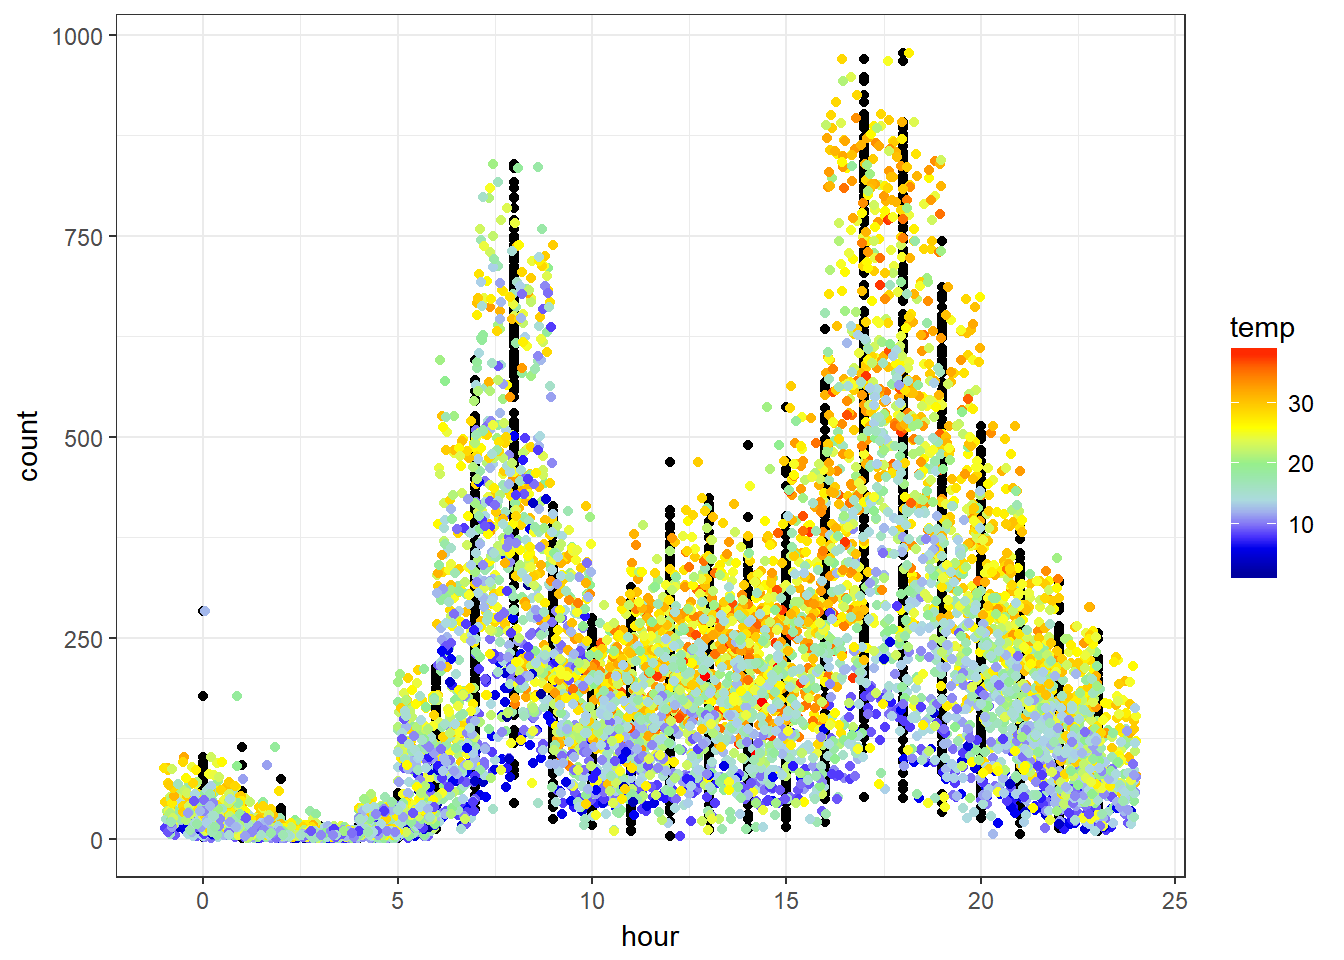 During non working days there is very less bike rental during morning hours and it eventually increases after noon.
This model will be predicting the count of the bike rental based on the temp variable.
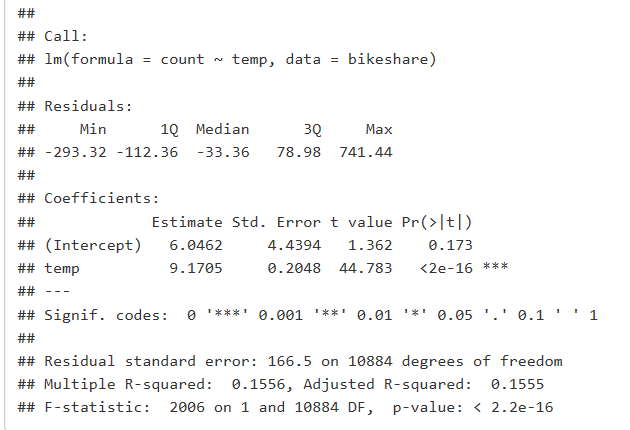
** Based on the value of Intercept which is 6.0462, linear regression model predicts that there will be 6 bike rental when the temperature is 0. ** For temp variable Estimated Std. value is 9.1705 which signigies that a temperature increase of 1 celsius holding all things equal is associated with a rental increase of about 9.1 bikes. ** The above findings is not a Causation and Beta 1 would be negative if an increase in temperature was associated with a decrease in rentals.
Model that attempts to predict count based off of the following features :- season holiday workingday weather temp humidity windspeed hour (factor)
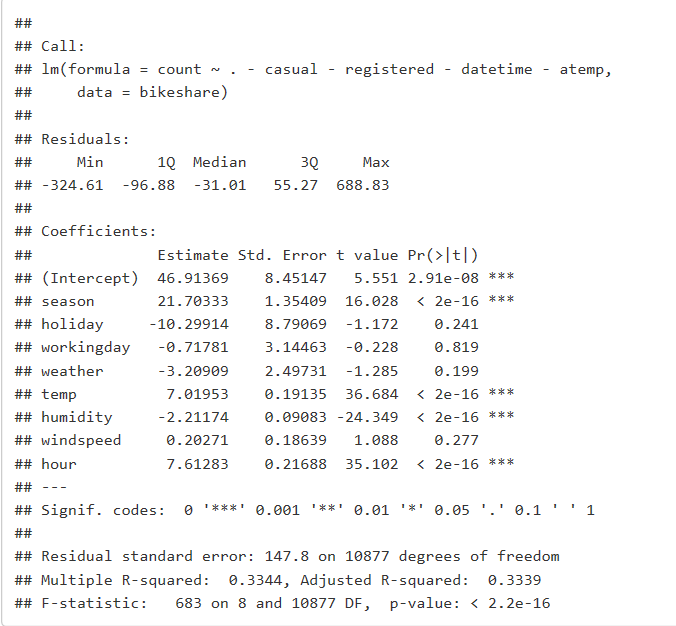
This sort of model doesn’t work well given our seasonal and time series data. We need a model that can account for this type of trend. We will get thrown off with the growth of our dataset accidentaly attributing to the winter season instead of realizing it’s just overall demand growing.