Updated Occupancies #147
Updated Occupancies #147
Conversation
|
/run all |
|
There was a problem while building and running with CMSSW. The logs can be found here. |
|
@ariostas Seems like an issue with the CMSSW tests? Something about alpaka math? |
|
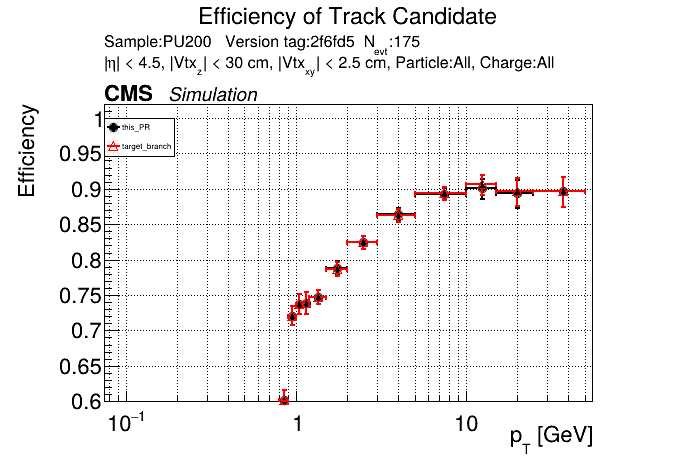
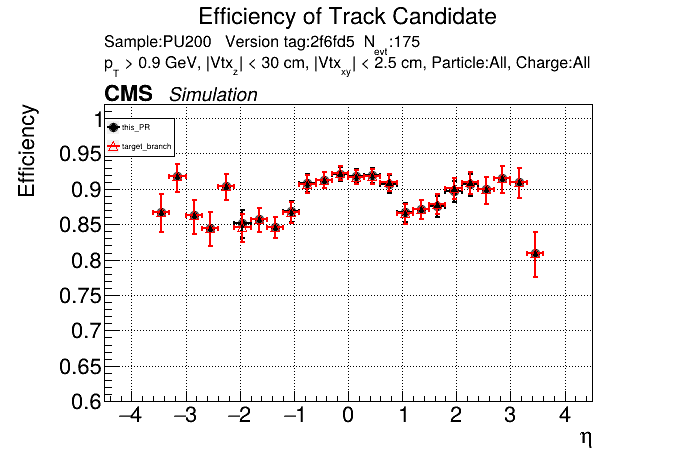
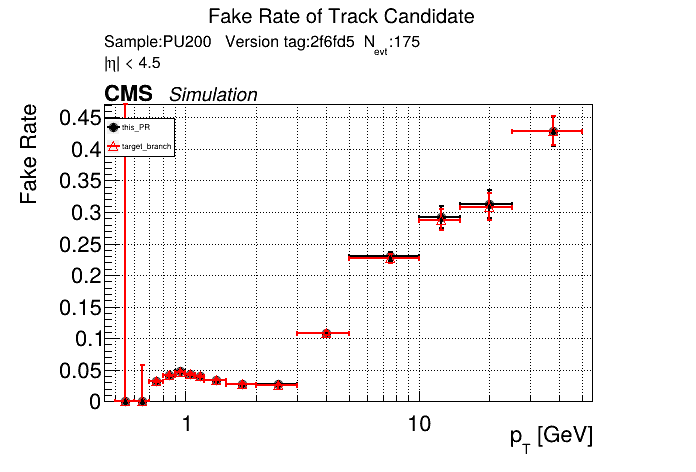
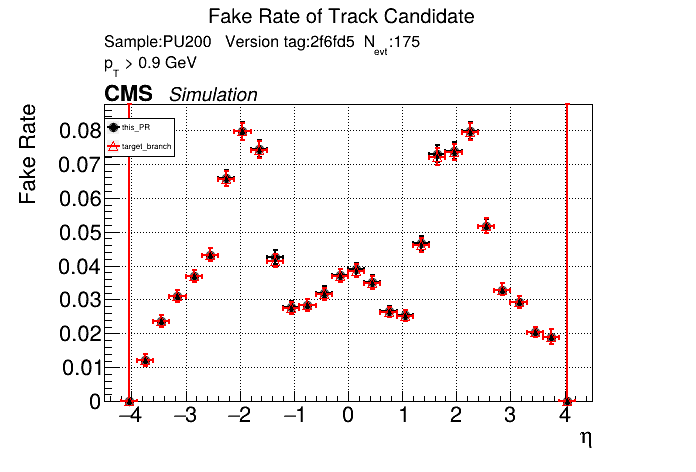
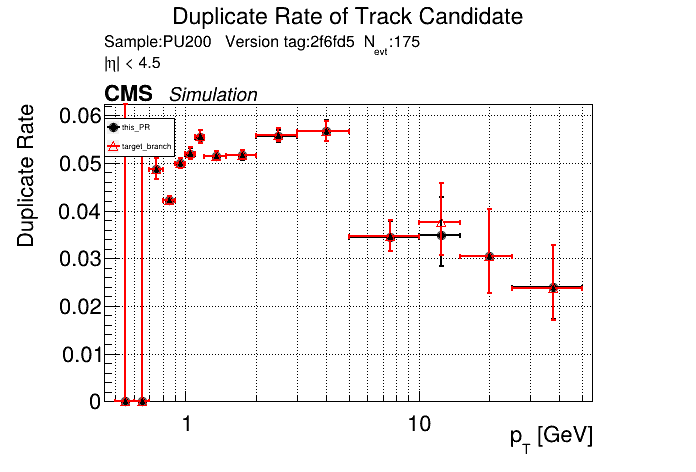
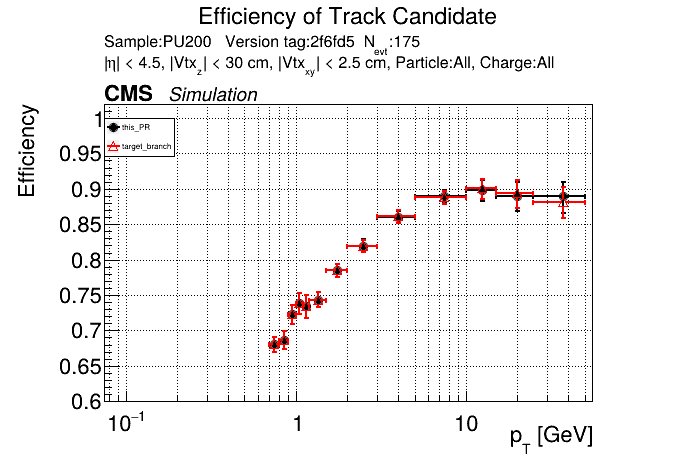
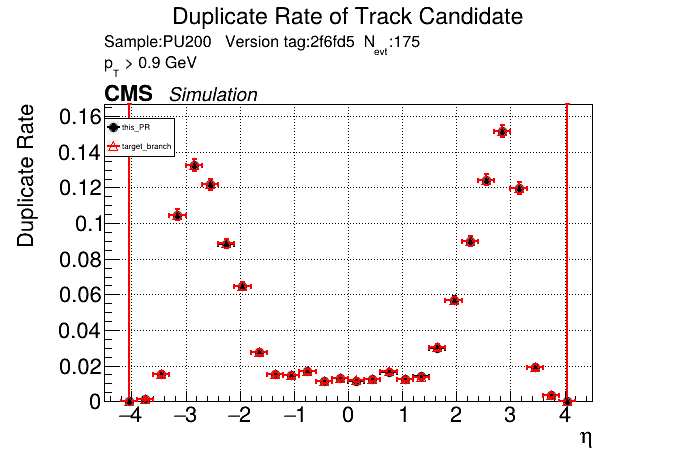
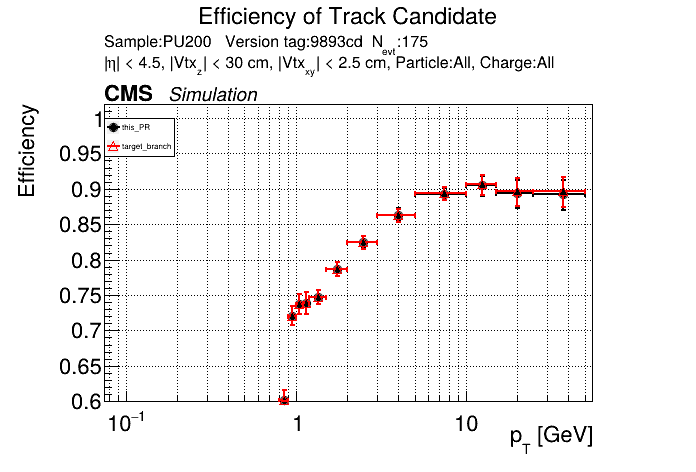
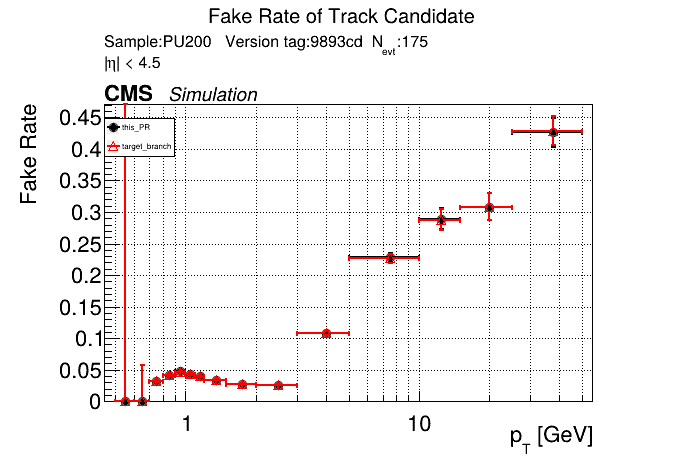
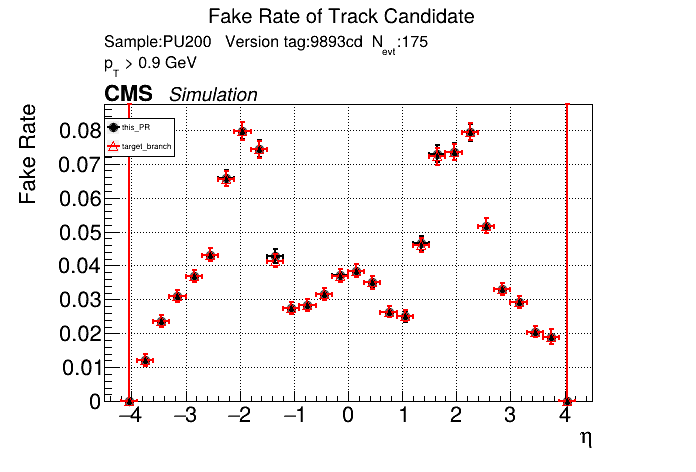
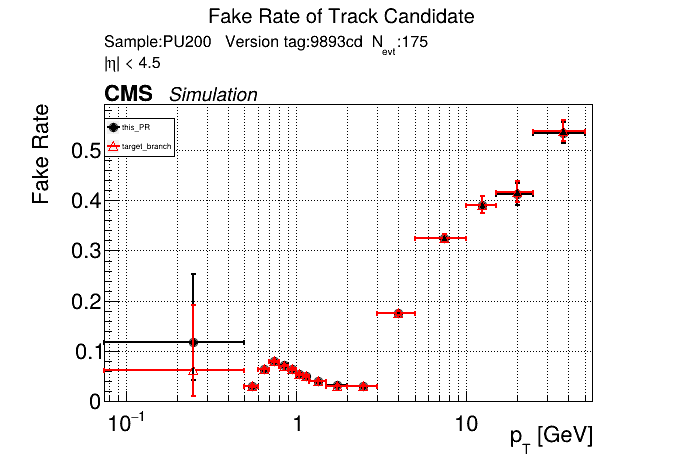
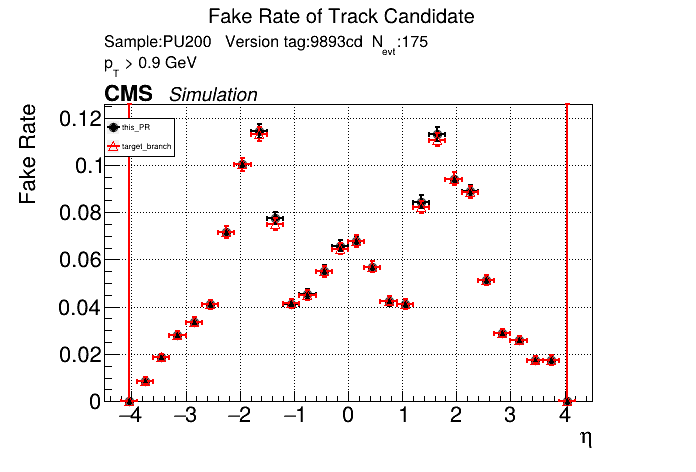
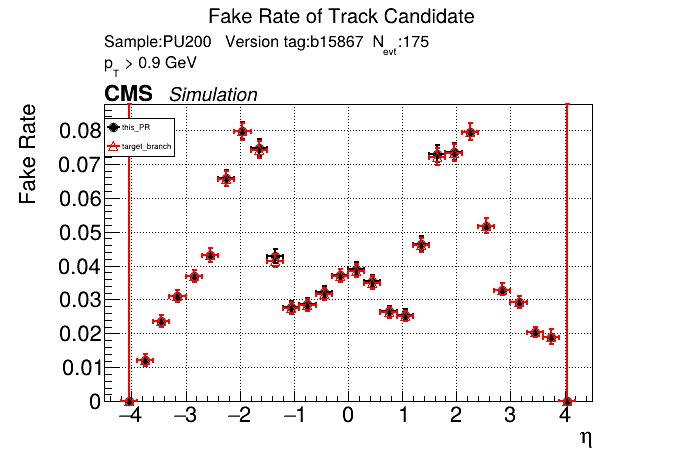
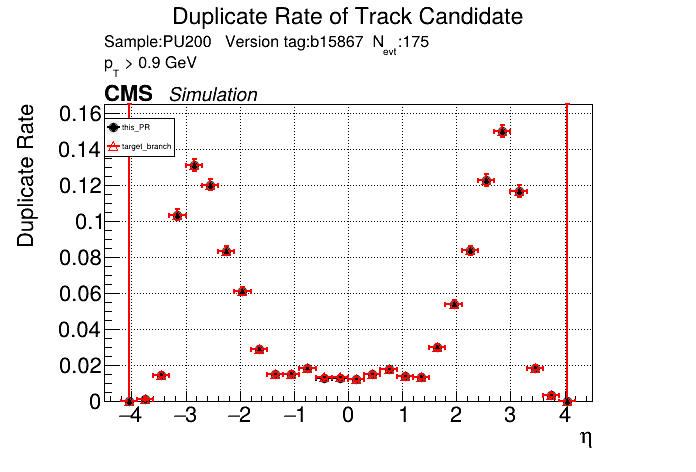
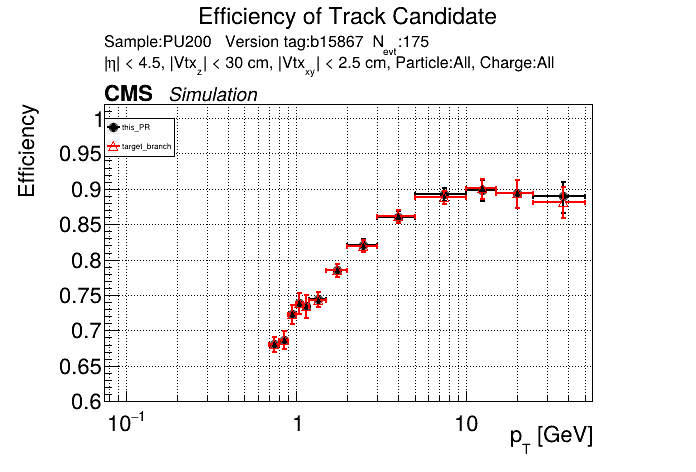
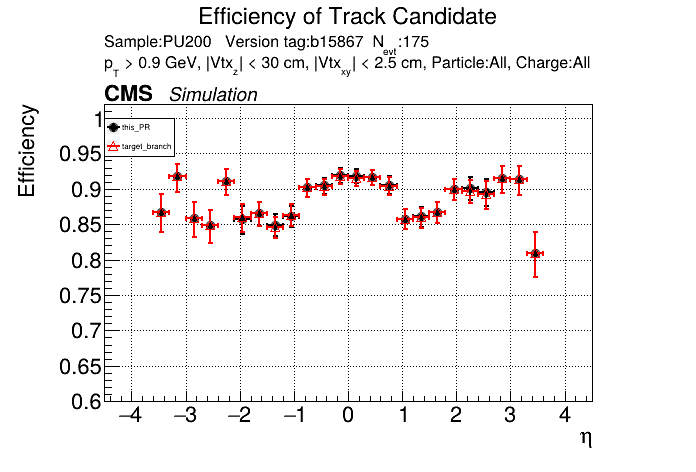
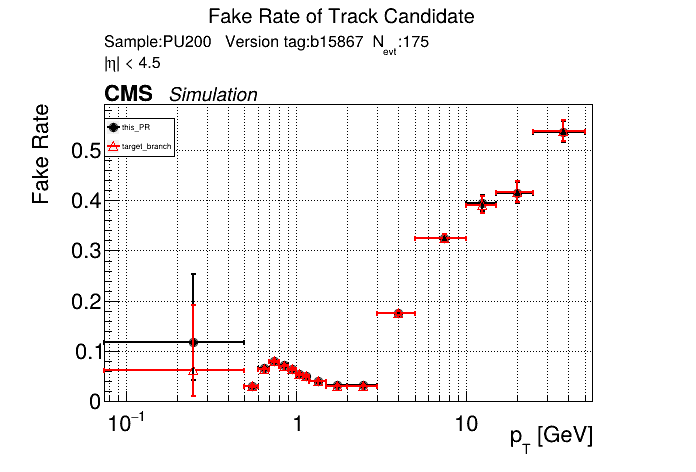
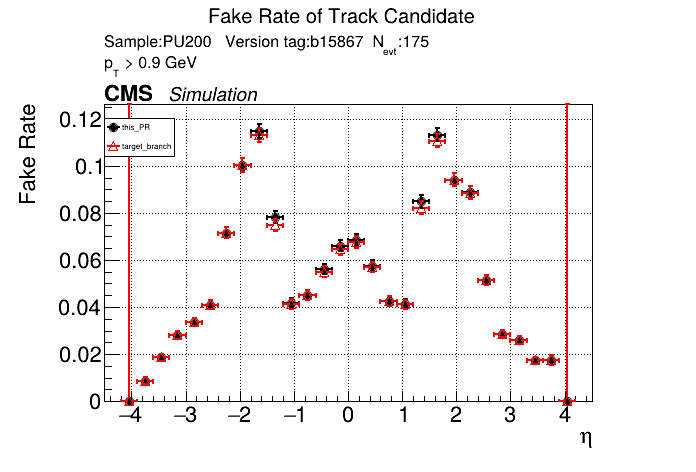
The PR was built and ran successfully in standalone mode. Here are some of the comparison plots.
The full set of validation and comparison plots can be found here. Here is a timing comparison: |

|
/run standalone lowpt |
|
Oh that's a package that was recently introduced by Manos. You could cherry-pick that commit or see if by early next week the CMSSW PR finally gets merged so that you can rebase |
|
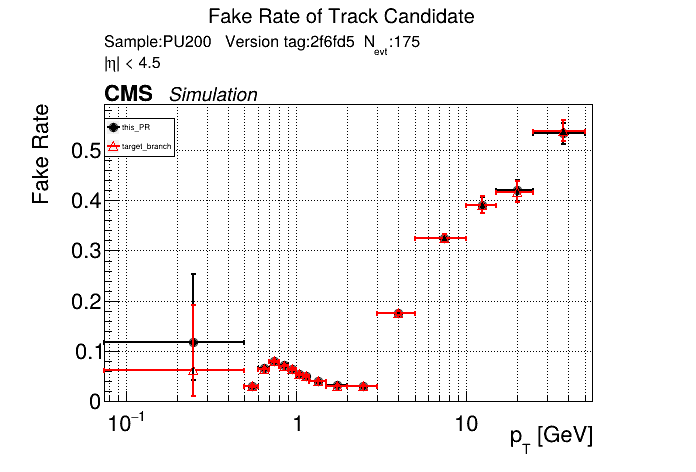
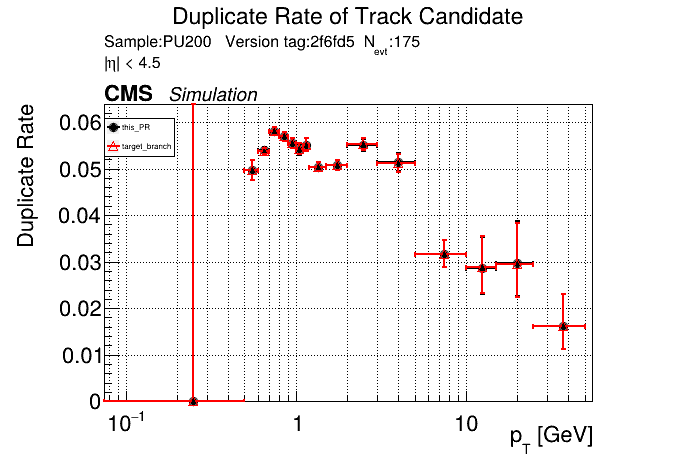
The PR was built and ran successfully in standalone mode (low pT setup). Here are some of the comparison plots.
The full set of validation and comparison plots can be found here. Here is a timing comparison: |


RecoTracker/LSTCore/standalone/analysis/occupancy/compute_occupancies.ipynb
Show resolved
Hide resolved
| {0, 38, 46, 39} // category 3 | ||
| {668, 271, 105, 59}, // category 0 | ||
| {738, 310, 0, 0}, // category 1 | ||
| {0, 13, 5, 0}, // category 2 |
There was a problem hiding this comment.
which kinematic regions are these 4 bins? (to follow up on the discussion during the meeting for why earlier zeroes are now not)

There was a problem hiding this comment.
this still requires parsing: what are the two middle elements out of 4 in the category 2?
Is Category 2 defined by radius and z range or by the disk and ring index in the endcap?
There was a problem hiding this comment.

Definition of Category 2: (module_layers >= 4) & (module_subdets == 5)
Definition of Eta ranges:
eta_numbers[module_eta < 0.75] = 0
eta_numbers[(module_eta >= 0.75) & (module_eta < 1.5)] = 1
eta_numbers[(module_eta >= 1.5) & (module_eta < 2.25)] = 2
eta_numbers[(module_eta >= 2.25) & (module_eta < 3)] = 3
2f6fd57 to
9893cdf
Compare
|
/run all |
|
There was a problem while building and running with CMSSW. The logs can be found here. |
|
The PR was built and ran successfully in standalone mode. Here are some of the comparison plots.
The full set of validation and comparison plots can be found here. Here is a timing comparison: |


|
/run standalone lowpt |
|
The PR was built and ran successfully in standalone mode (low pT setup). Here are some of the comparison plots.
The full set of validation and comparison plots can be found here. Here is a timing comparison: |


01dceba to
f81b81b
Compare
|
/run standalone |
|
There was a problem while building and running in standalone mode. The logs can be found here. |
f81b81b to
9893cdf
Compare
|
Moving the dynamic memory allocation to #148 |
|
I think it makes sense to merge #148 first and then quickly reevaluate the occupancy thresholds. It's likely we can increase the caps now without a huge increase in memory in order to decrease truncation. |
9893cdf to
c457a97
Compare
c457a97 to
4387b02
Compare
|
/run all |
|
The PR was built and ran successfully in standalone mode. Here are some of the comparison plots.
The full set of validation and comparison plots can be found here. Here is a timing comparison: |


|
/run standalone lowpt |
|
The PR was built and ran successfully in standalone mode (low pT setup). Here are some of the comparison plots.
The full set of validation and comparison plots can be found here. Here is a timing comparison: |


 slava77
left a comment
slava77
left a comment
There was a problem hiding this comment.
Please remind to me the logistics of making the input analysis: "500_new_occ_0p8.root"
Was it made with some xNNN or more relaxed limits to get an (almost) unbiased input; or is there an option where a full n*m (inner times outer actual untrancated array is allocated) ?
This should be documented in some way.
| {0, 107, 102, 0}, // category 2 | ||
| {0, 64, 79, 85} // category 3 | ||
| {740, 314, 230, 60}, // category 0 | ||
| {1097, 693, 0, 0}, // category 1 |
There was a problem hiding this comment.
a factor of 5 increase here: was the target quantile incidentally lower before?
There was a problem hiding this comment.
Yes, category 1 here was set to 99% before. I increased it to 99.99% to match the other categories.
| {0, 0, 0, 0}, // category 2 | ||
| {0, 38, 46, 39} // category 3 | ||
| {1373, 702, 326, 83}, // category 0 | ||
| {1323, 653, 0, 0}, // category 1 |
There was a problem hiding this comment.
close to x3 increase; similar to T5s: was it a different quantile previously or is this a result of an increase in the LS occupancy?
There was a problem hiding this comment.
I updated the percentiles here from 99.9% to 99.99% to match the other objects.
|
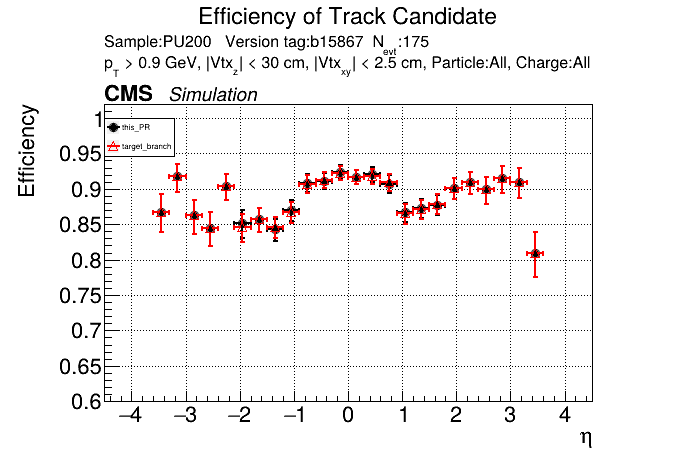
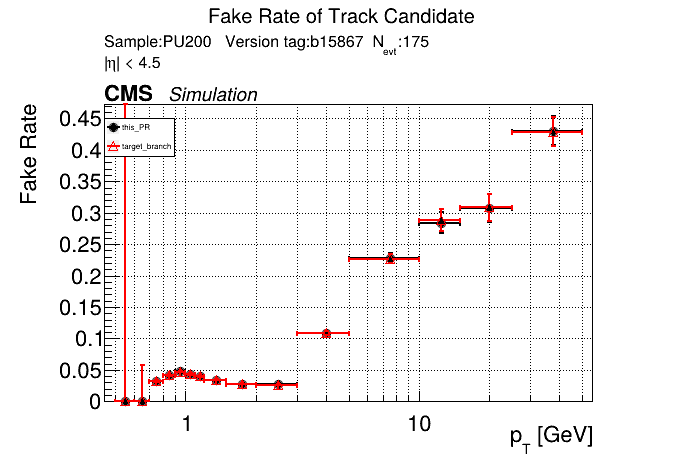
The PR was built and ran successfully with CMSSW. Here are some plots. OOTB All Tracks
The full set of validation and comparison plots can be found here. |

|
@GNiendorf |
|
looking at pt08 validation results, do I understand correctly that pT5 efficiency goes up quite a bit (5% at high pt) 
|
Yes, I saw that as well in the performance plots. |

|
The upper bound matrices don't have a huge effect on the total memory usage anymore with my latest PR merged in. 0p8 pT Threshold, 1 streams, 500 events: New - 1615MiB 0p8 pT Threshold, 8 streams, 500 events: New - 6879MiB A 13.5% increase for 1 stream and a 20% total memory increase for 8 streams. I think that with the increase in pT5 efficiency and the reduced truncations frequency it is worth it. I saw a reduction in my dynamic occ PR for single stream of ~25%, so we would still have a net decrease in total memory from where we started. Right now we are trying to reduce the number of fakes stored in memory by applying artificially lower occupancies in certain regions and for certain objects. Maybe the cuts for those objects should be reevaluated and tightened instead? I think the T3 DNN will likely reduce the triplet occupancies as well. Truncations (0p8 pT Threshold, 10 events): New - MDs - 107 Current - MDs - 313 |
perhaps a note can be added to the notebook; although just having it in this PR description may be enough. |
All you need to do is compile the code with the -d option. The variables used to determine the occupancies are incremented if an object passes all selections, regardless of whether it is stored or not. |
isn't this limited to one step then? |
Oh yeah, good point... I guess that is why the T3's are still truncated so much? I was trying to figure that one out. |
|
minimally, a test would be nice to use a root file made with the latest occupancy limits in the analyzer to check if these don't grow further. |
could be. I wouldn't worry about limits that went up by 20-50%, but the components that went up by x3-6 may be significantly truncated downstream. |
b15867d to
6397964
Compare
|
I did a second pass on the occupancies and the T3 ones go up quite a bit. I'm going to work on my T3 DNN PR for a bit and come back to this, not sure what the optimal solution is here. 1 stream value for 500 events stays constant at ~1615MiB but 8 stream goes up more from 6879MiB->~7280MiB. So that would be a 27% increase in total memory at 8 streams from current 5743MiB. Triplet excesses go down to 1,178, so in total a 95% decrease in truncations for all objects (25,201->1,402 for 10 events). |
|
Replaced by #180. |
Updated occupancies for all LST objects, and small updates to the notebook for printing them.
The upper bound matrices don't have a huge effect on the total memory usage anymore with my latest PR merged in.
0p8 pT Threshold, 1 streams, 500 events:
New - 1615MiB
Current (with dynamic occ PR) - 1423MiB
0p8 pT Threshold, 8 streams, 500 events:
New - 6879MiB
Current (with dynamic occ PR) - 5743MiB
A 13.5% increase for 1 stream and a 20% total memory increase for 8 streams. I think that with the increase in pT5 efficiency and the reduced truncations frequency it is worth it. I saw a reduction in my dynamic occ PR for single stream of ~25%, so we would still have a net decrease in total memory from where we started. Right now we are trying to reduce the number of fakes stored in memory by applying artificially lower occupancies in certain regions and for certain objects. Maybe the cuts for those objects should be reevaluated and tightened instead? I think the T3 DNN will likely reduce the triplet occupancies as well.
Truncations (0p8 pT Threshold, 10 events):
New -
MDs - 107
Segments - 117
Triplets - 3,556
Quints - 0
Current -
MDs - 313
Segments - 16,488
Triplets - 8,400
Quints - 0