"LendingClub is a US peer-to-peer lending company, headquartered in San Francisco, California. It was the first peer-to-peer lender to register its offerings as securities with the Securities and Exchange Commission (SEC), and to offer loan trading on a secondary market. LendingClub is the world's largest peer-to-peer lending platform." Wikipedia-Lending club On the LendingClub platform, people invest on other people loan through an online secured system. On these types of platforms, in the most cases, the main criteria of giving loans to costumers is solely based on their credit scores, so that a customer with lower credit score (more risky) get higher rate and customer with higher credit score (less risky) get lower interest rate for their loan. Obviously, from the investor point of view, the loans with higher interest rate are more attractive due to their higher return of investment. However, it also has high risk of being not returned at all. So, investing on "Bad loans" or charged-off, which means you loose your asset, is more worse than loosing an opportunity to gain more profit. The machine learning/deep learning model that could predict which of the high interest loans are more likely to be returned, would bring added value by minimizing the associated risks. Also, using other factors along with credit score may help us to identify the high risky loans and minimize the investors loss of money more accurately. Problem statement In the last few years, applying for different types of loans through online peer-to-peer lending platforms such as the LendingClub is raising.
- First is to try to find a better prediction model to prevent investing on '"bad loans". To do that, First, going to implement some data engineering and preprocessing on LendingClub dataset to prepare data for analysis and modeling.
- Second, need to apply explanatory data analysis (EDA) to investigate the features.
- Preprocessed data on LendingClub loans labeled on whether or not the borrower defaulted (charged-off) to develop a model and predict whether or not a borrower will pay back their loan. This way in the future when we get a new potential customer who assigned with higher interest loan, we can assess whether or not they are likely to pay back the loan.
We used LendigClub Dataset possessing almost all features including FICO scores. This dataset contains more than several millions data and because, here, We only use a normal laptop to analyze and model this dataset, thus, We only selected the loans issued in 2018 (almost 0.5 million data) to reduce the processing time.
Moreover, some of the features in this dataset are only relevant after loans are issued and thus, not available at the moment of investing. For this reason, We used features list from here that are available and visible to investors before issuing a loan. To match this feature list to the main dataset, We did some simple and primary cleaning, whitespace removing, and spell corrections using dropping and “regular expression” technique. Also, it requires to check the unmatched features to see if some of them could be matched manually.
• In this project, we have p prepared a processed dataset by and collected the clear-cut data available on https://www.kaggle.com/wordsforthewise/lending-club.
• Using pandas data frame, we have calculated the percent of Non-null values in each columns.
• Then removed the columns that had large number of Null value or were irrelevant to the analysis.
• Then separated the columns with numerical values to those that have categorical values.
• By using the fillna we have filled all the remaining numerical value columns with empty values with mean of the columns.
• By using the fillna we have filled all the remaining Categorical value columns with empty values with mode of the columns.
• After handling the null values, we deal with skewness of the data.
• After checking the skewness, all the columns that are highly skewed are dropped using drop function.
• Then we checked for outlier tendency using kurtosis. Then we capped some outlier.
• Outliner were successfully handled. And after that we created the target variable that is Loan Status in this case.
• Loan status had too many unique values so instead we created a new variable taking the default as 1 and rest 0.
• We converted date object columns to integer years or months so that we can easily encode other categorical features
• without exhausting our resources.
• For filling the dates, we used the most used dates in that feature.
• Thus our data cleaning process was cleared.
• Member id is completely blank.
• Url column is irrelevant.
• There are 33 blank entries in the data set.
• Employee title has 167002 blank entries, which are normal because they might not exist.
• mths_since_last_delinq null values are normal, because they might not exist - make them 0
• mths_since_last_record null values are normal, because they might not exist - make them 0
• mths_since_last_major_derog make blank as 0
• annual_inc_joint make the blanks as NA
• dti_joint make the blanks as NA
• verification_status_joint make the blanks as NA
• last payment date blanks are one from whom all amount has been recovered - make them as NA for all the null values
• Change data type of emp_length, term, earliest_cr_line, last_pymnt_d, last_credit_pull_d
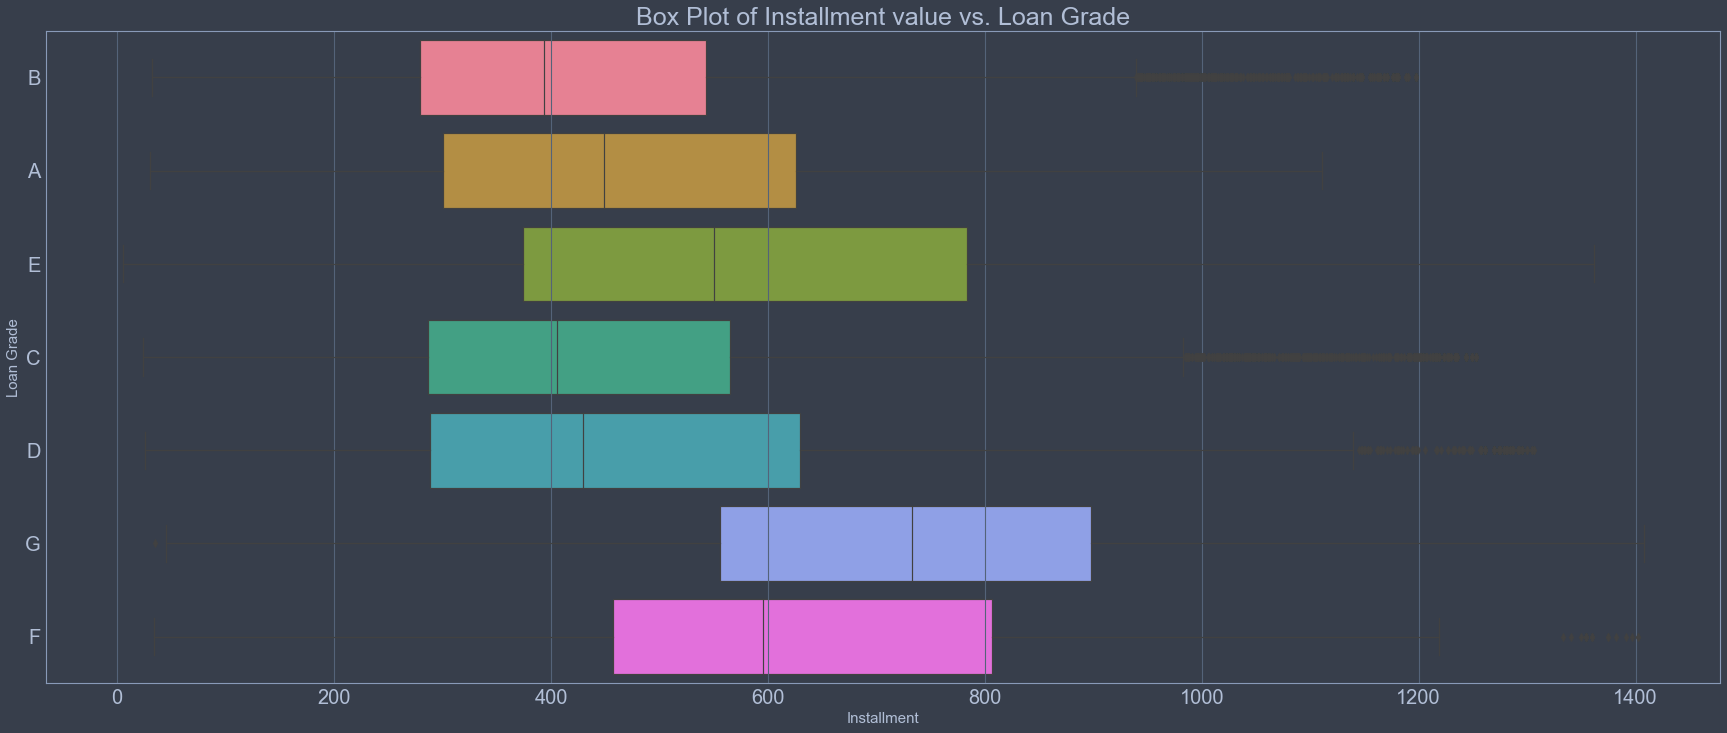
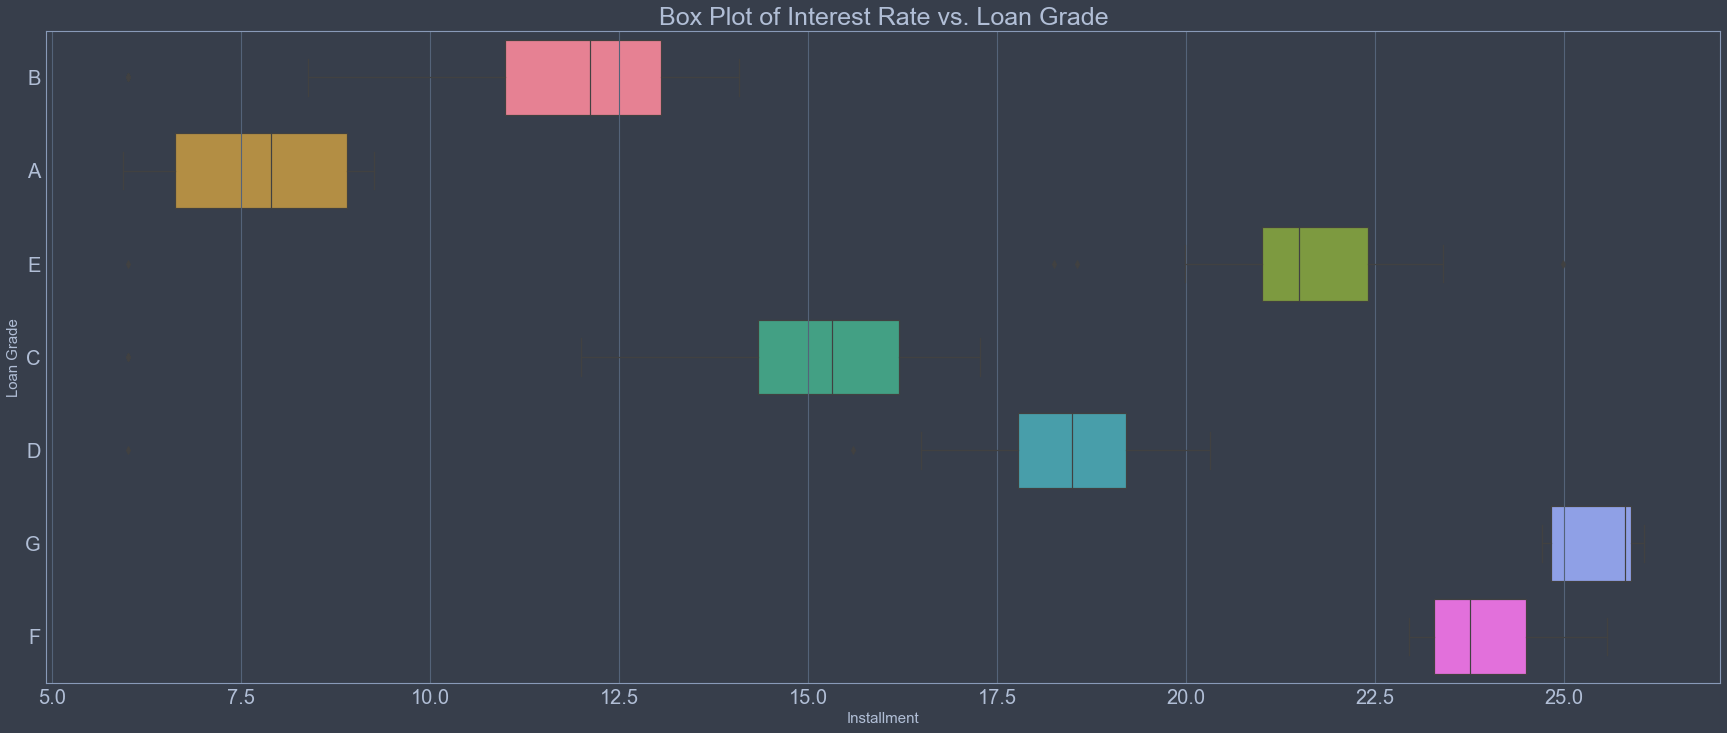
• The graph draws a pattern between the loan amount and grade. As the Grade goes down from A to G, the Average Loan Amount linearly increases.
• Additionally, it can be observed that the average loan amount of B grade loans is the least of all grades.
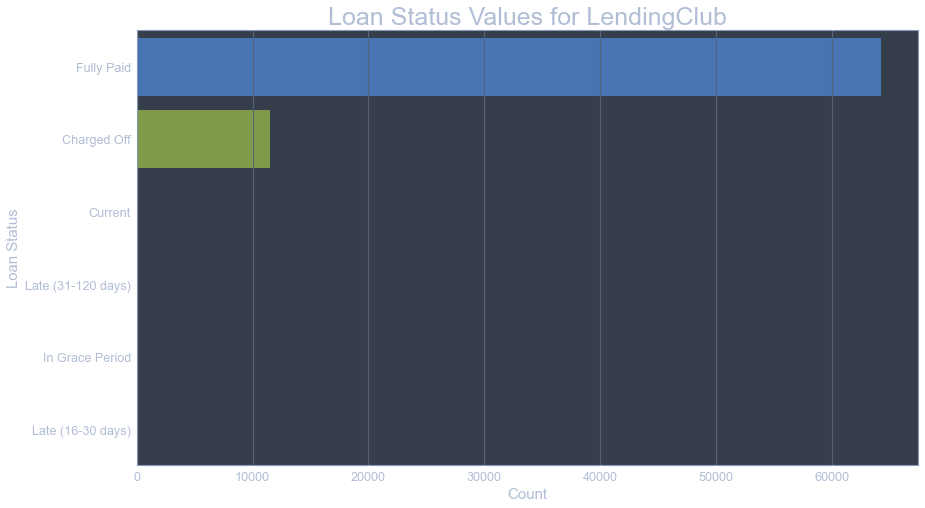
• The count of fully paid is more than the charged off.
• The dataset is slightly imbalanced and thus was balanced before the model training phase.
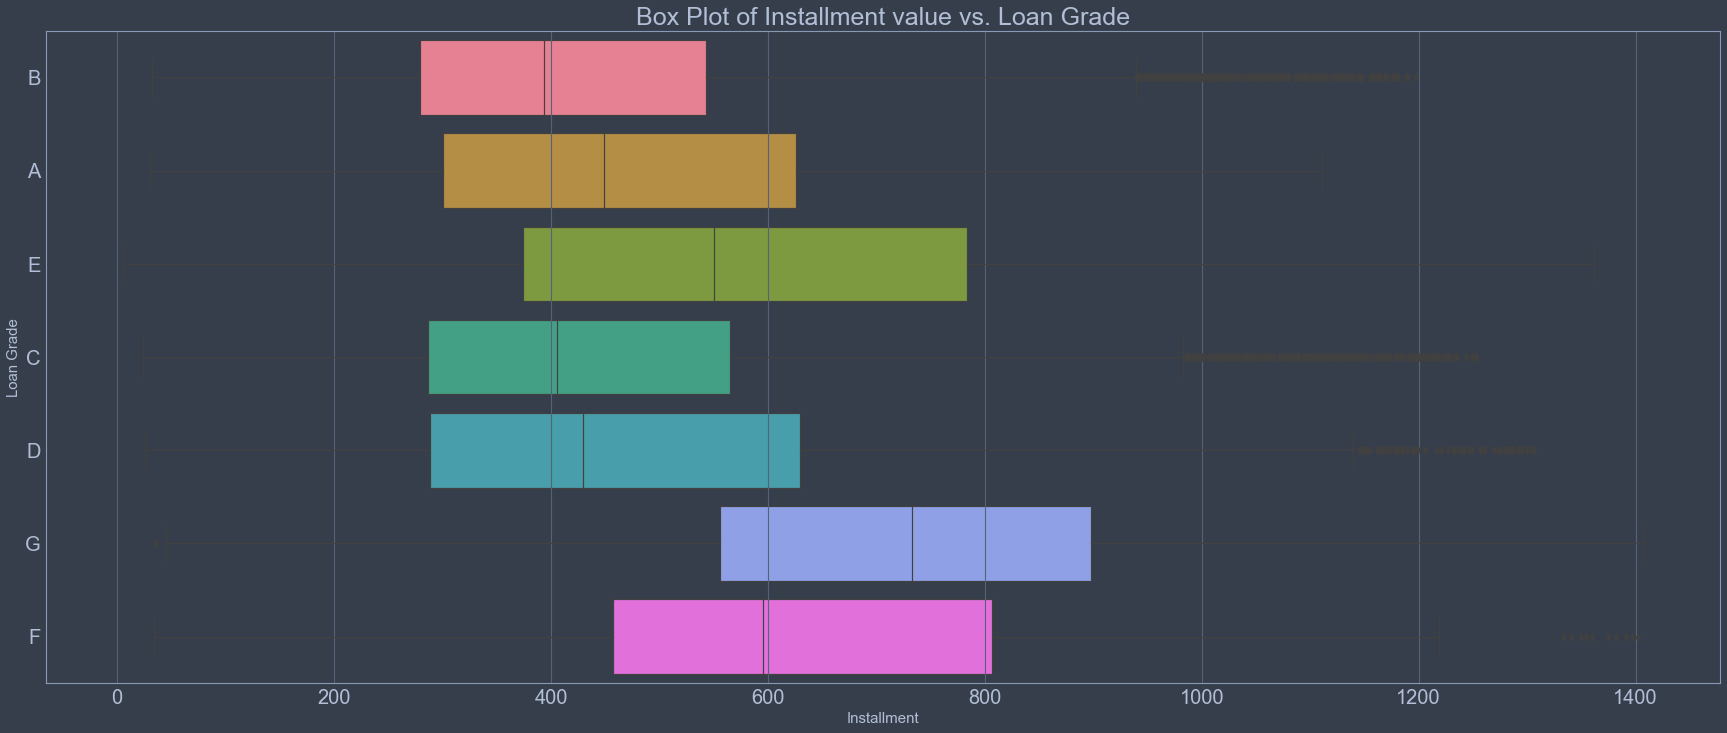
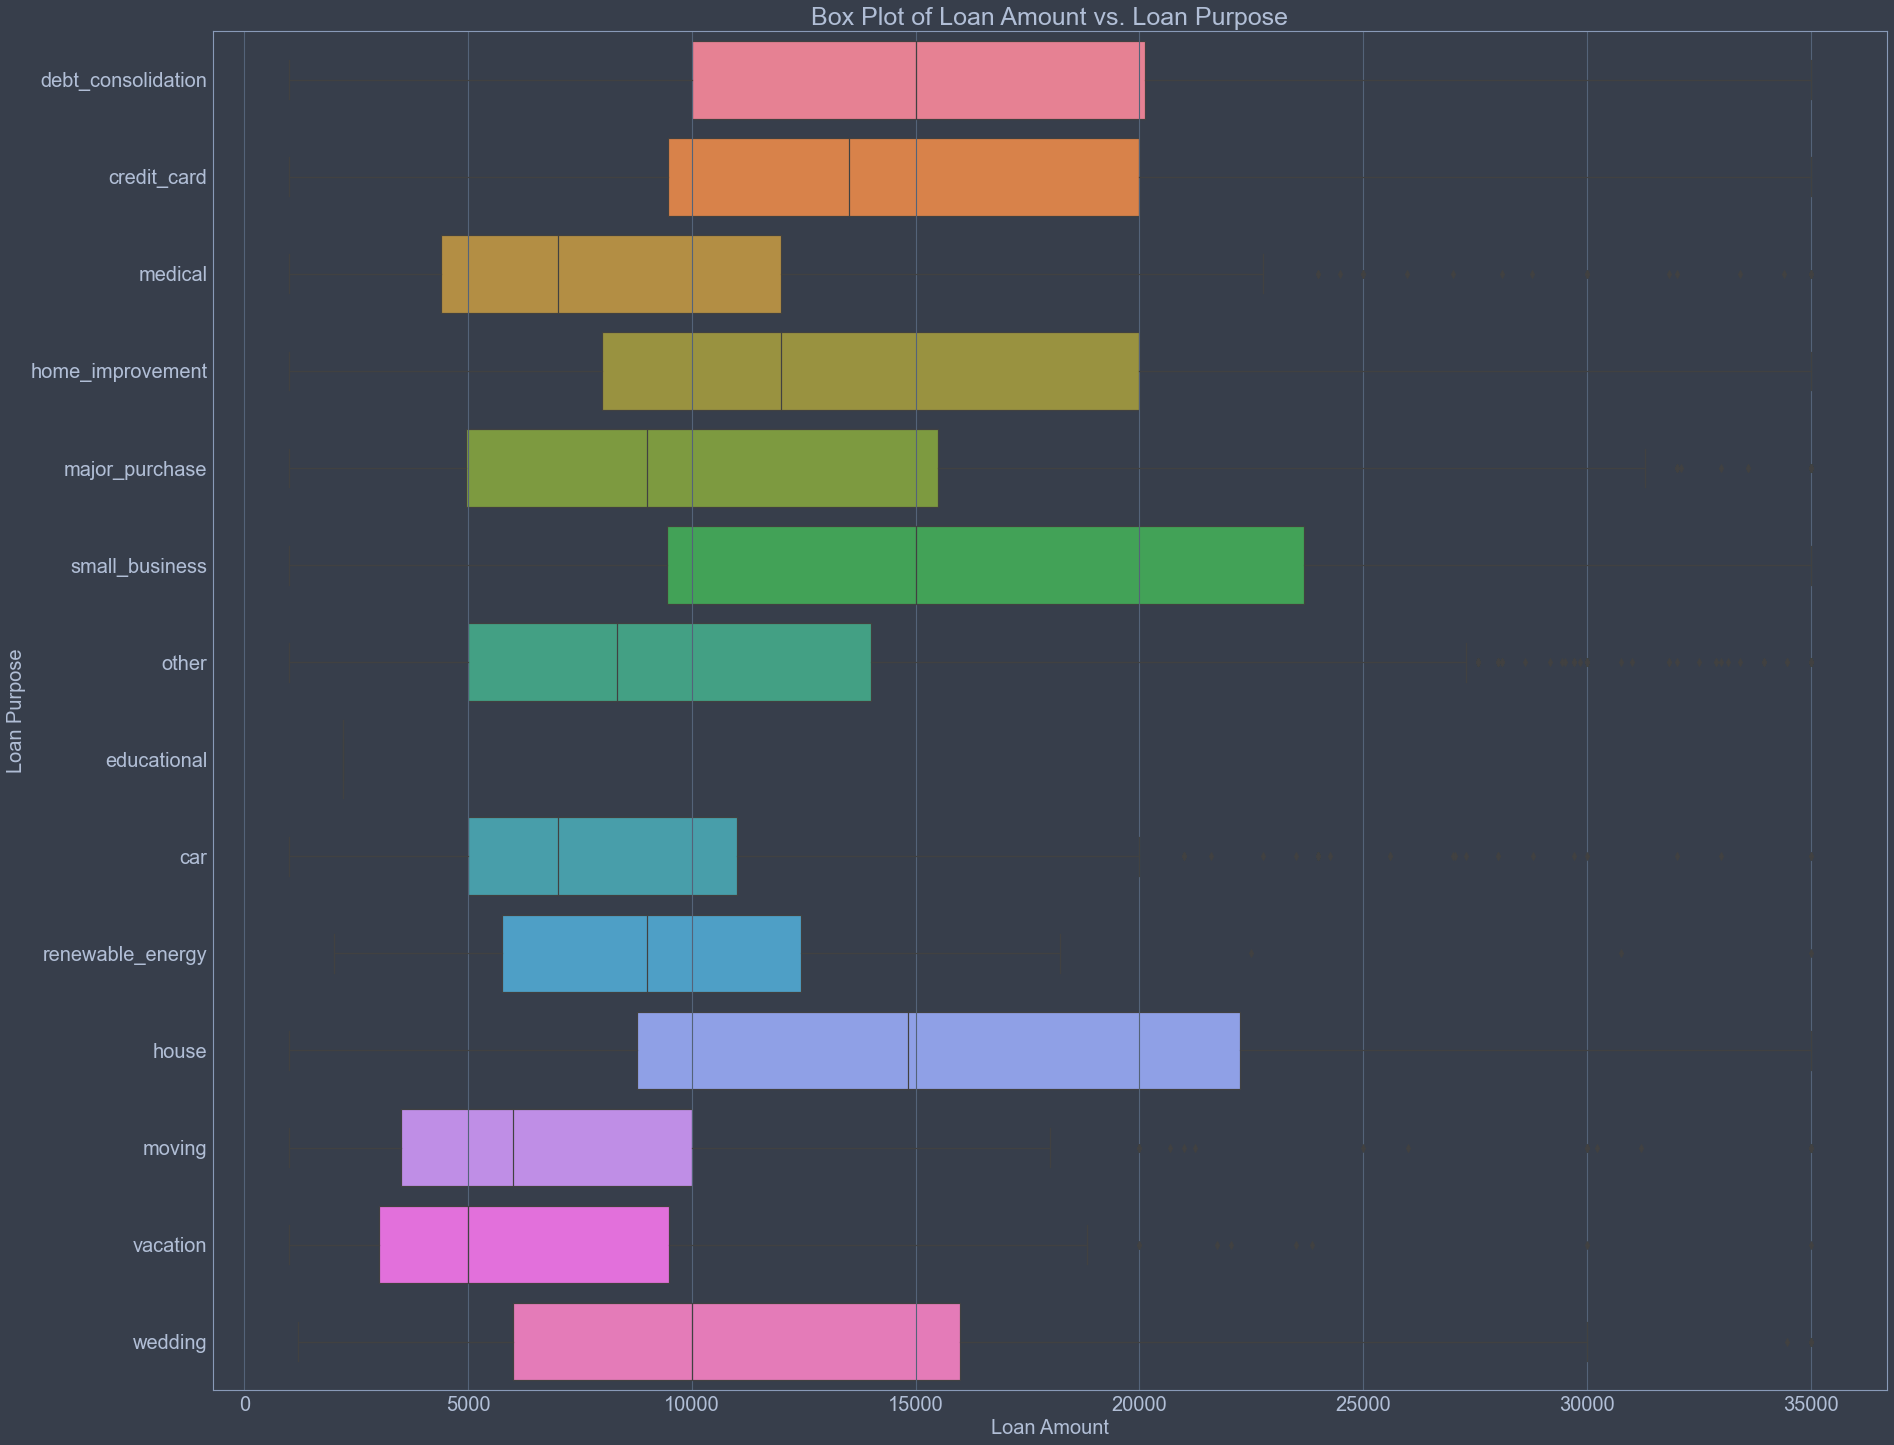
• It can be inferred from the scenario that larger loans generally appear to be given at a lower grade, with the median loan amount for a grade G loan being almost 5000 higher than that of a grade A, B, or C loan.
• Grade B, however, remains at the lowest in the range.
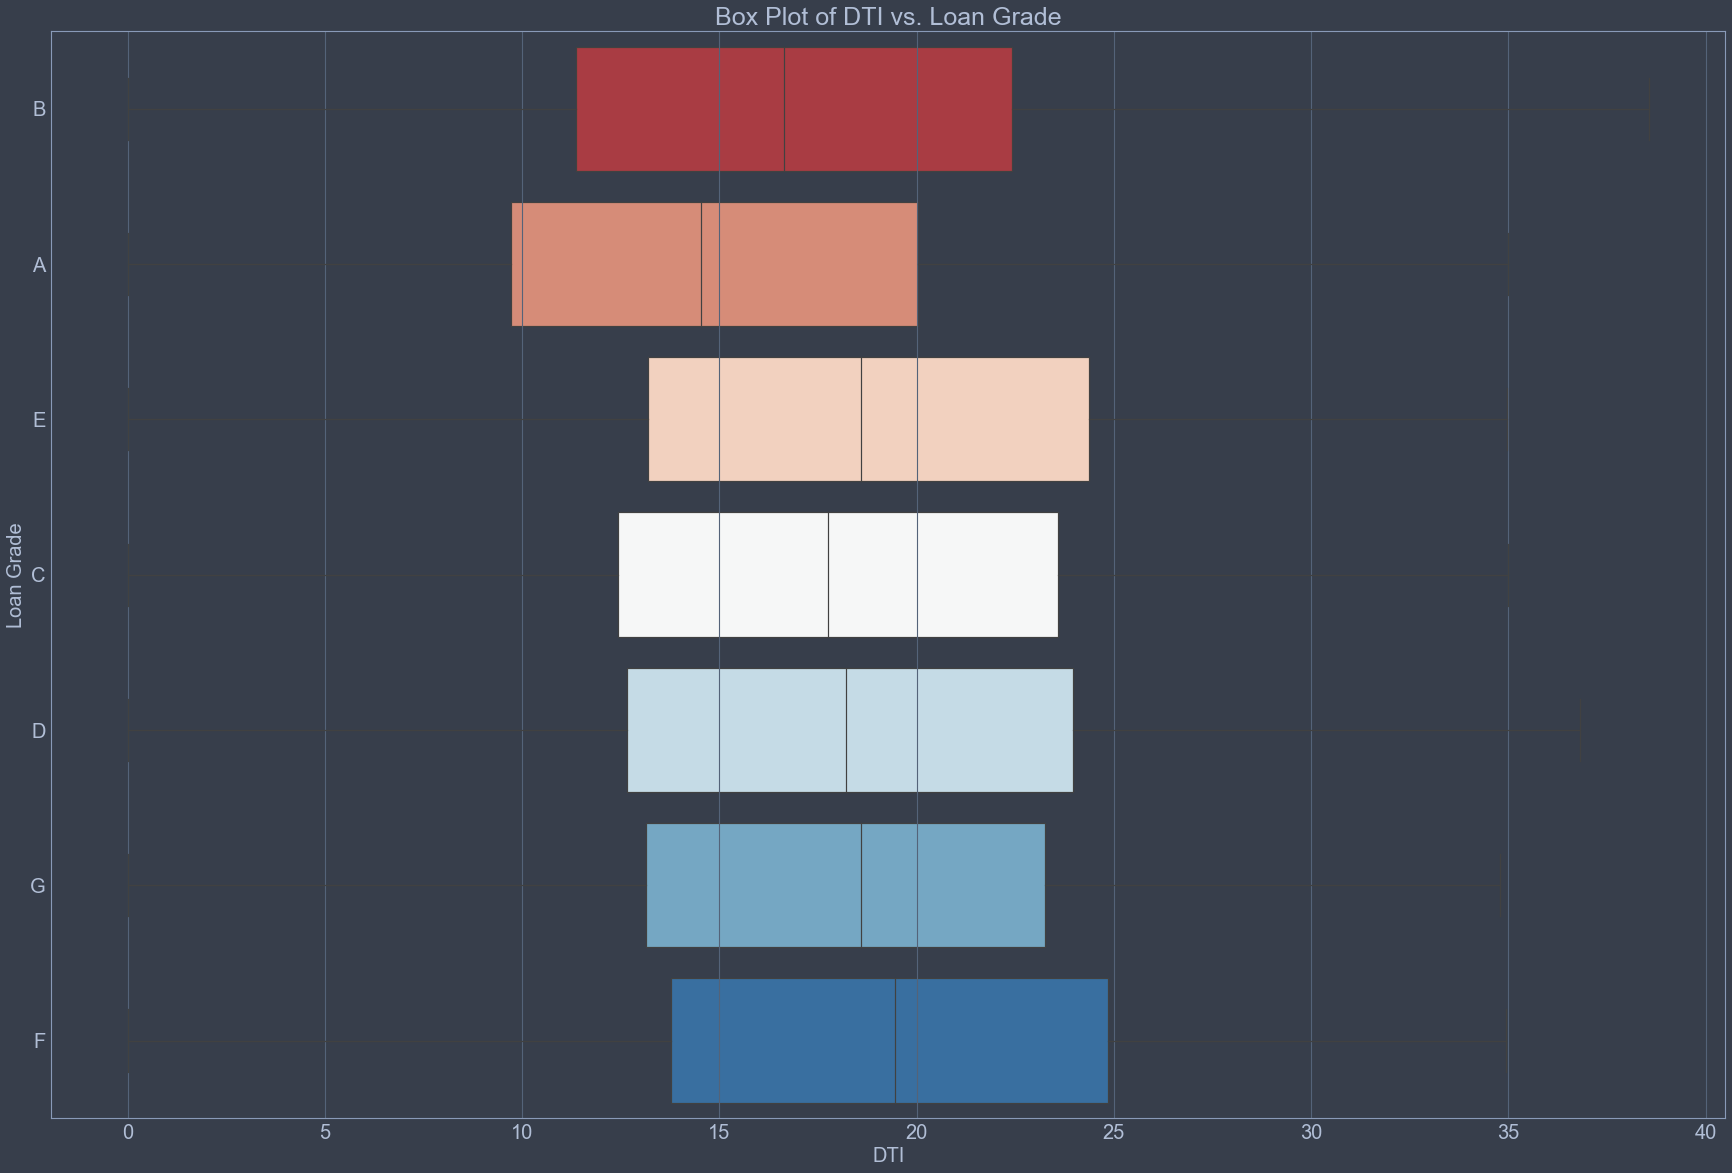
Selecting the pivotal determinants from the accepted data frame, 22 specific columns are selected for optimizing the target variable i.e. whether the loan is to be approved or not. Columns Selected for Training Model:
loan_amt zip_code
earliest_cr_line open_acc
fico_score total_acc
grade revol_util
sub_grade target
home_ownership issue_d
installment credit_history
int_rate credit_ratio
mort_acc installment_ratio
term annual_inc
verification_status dti
A random forest is a meta estimator that fits a number of decision tree classifiers on various sub-samples of the dataset and uses averaging to improve the predictive accuracy and control over-fitting. • Parameters Used o n_estimators : 10 ; defines the number of trees in the forest o random_state=10 ; Controls both the randomness of the bootstrapping of the samples used when building trees and the sampling of the features. o max_depth = 6;
Joint Account Result Table:

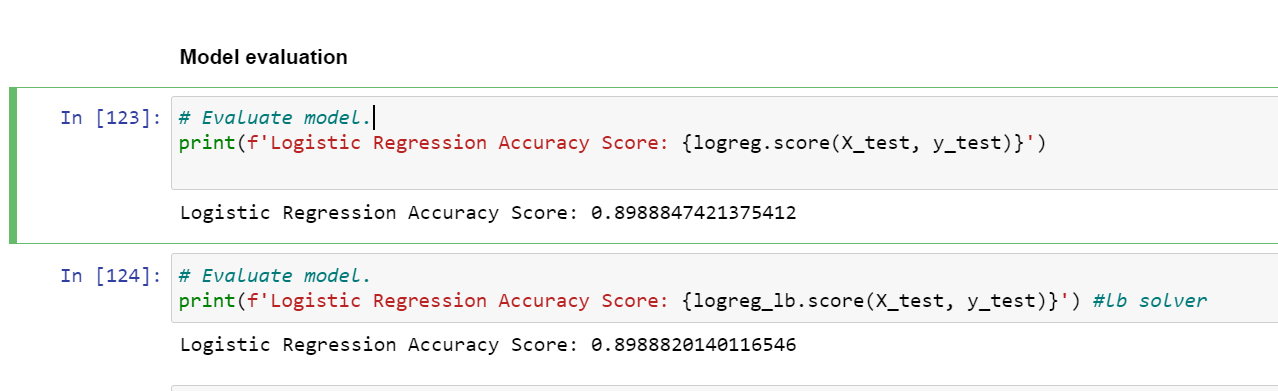
In Logistic Regression above performed, if no solver is mentioned i.e. ‘none’ is used, then regression is not applied.
• Parameters used: o C = 1; o Solver = ‘none’;