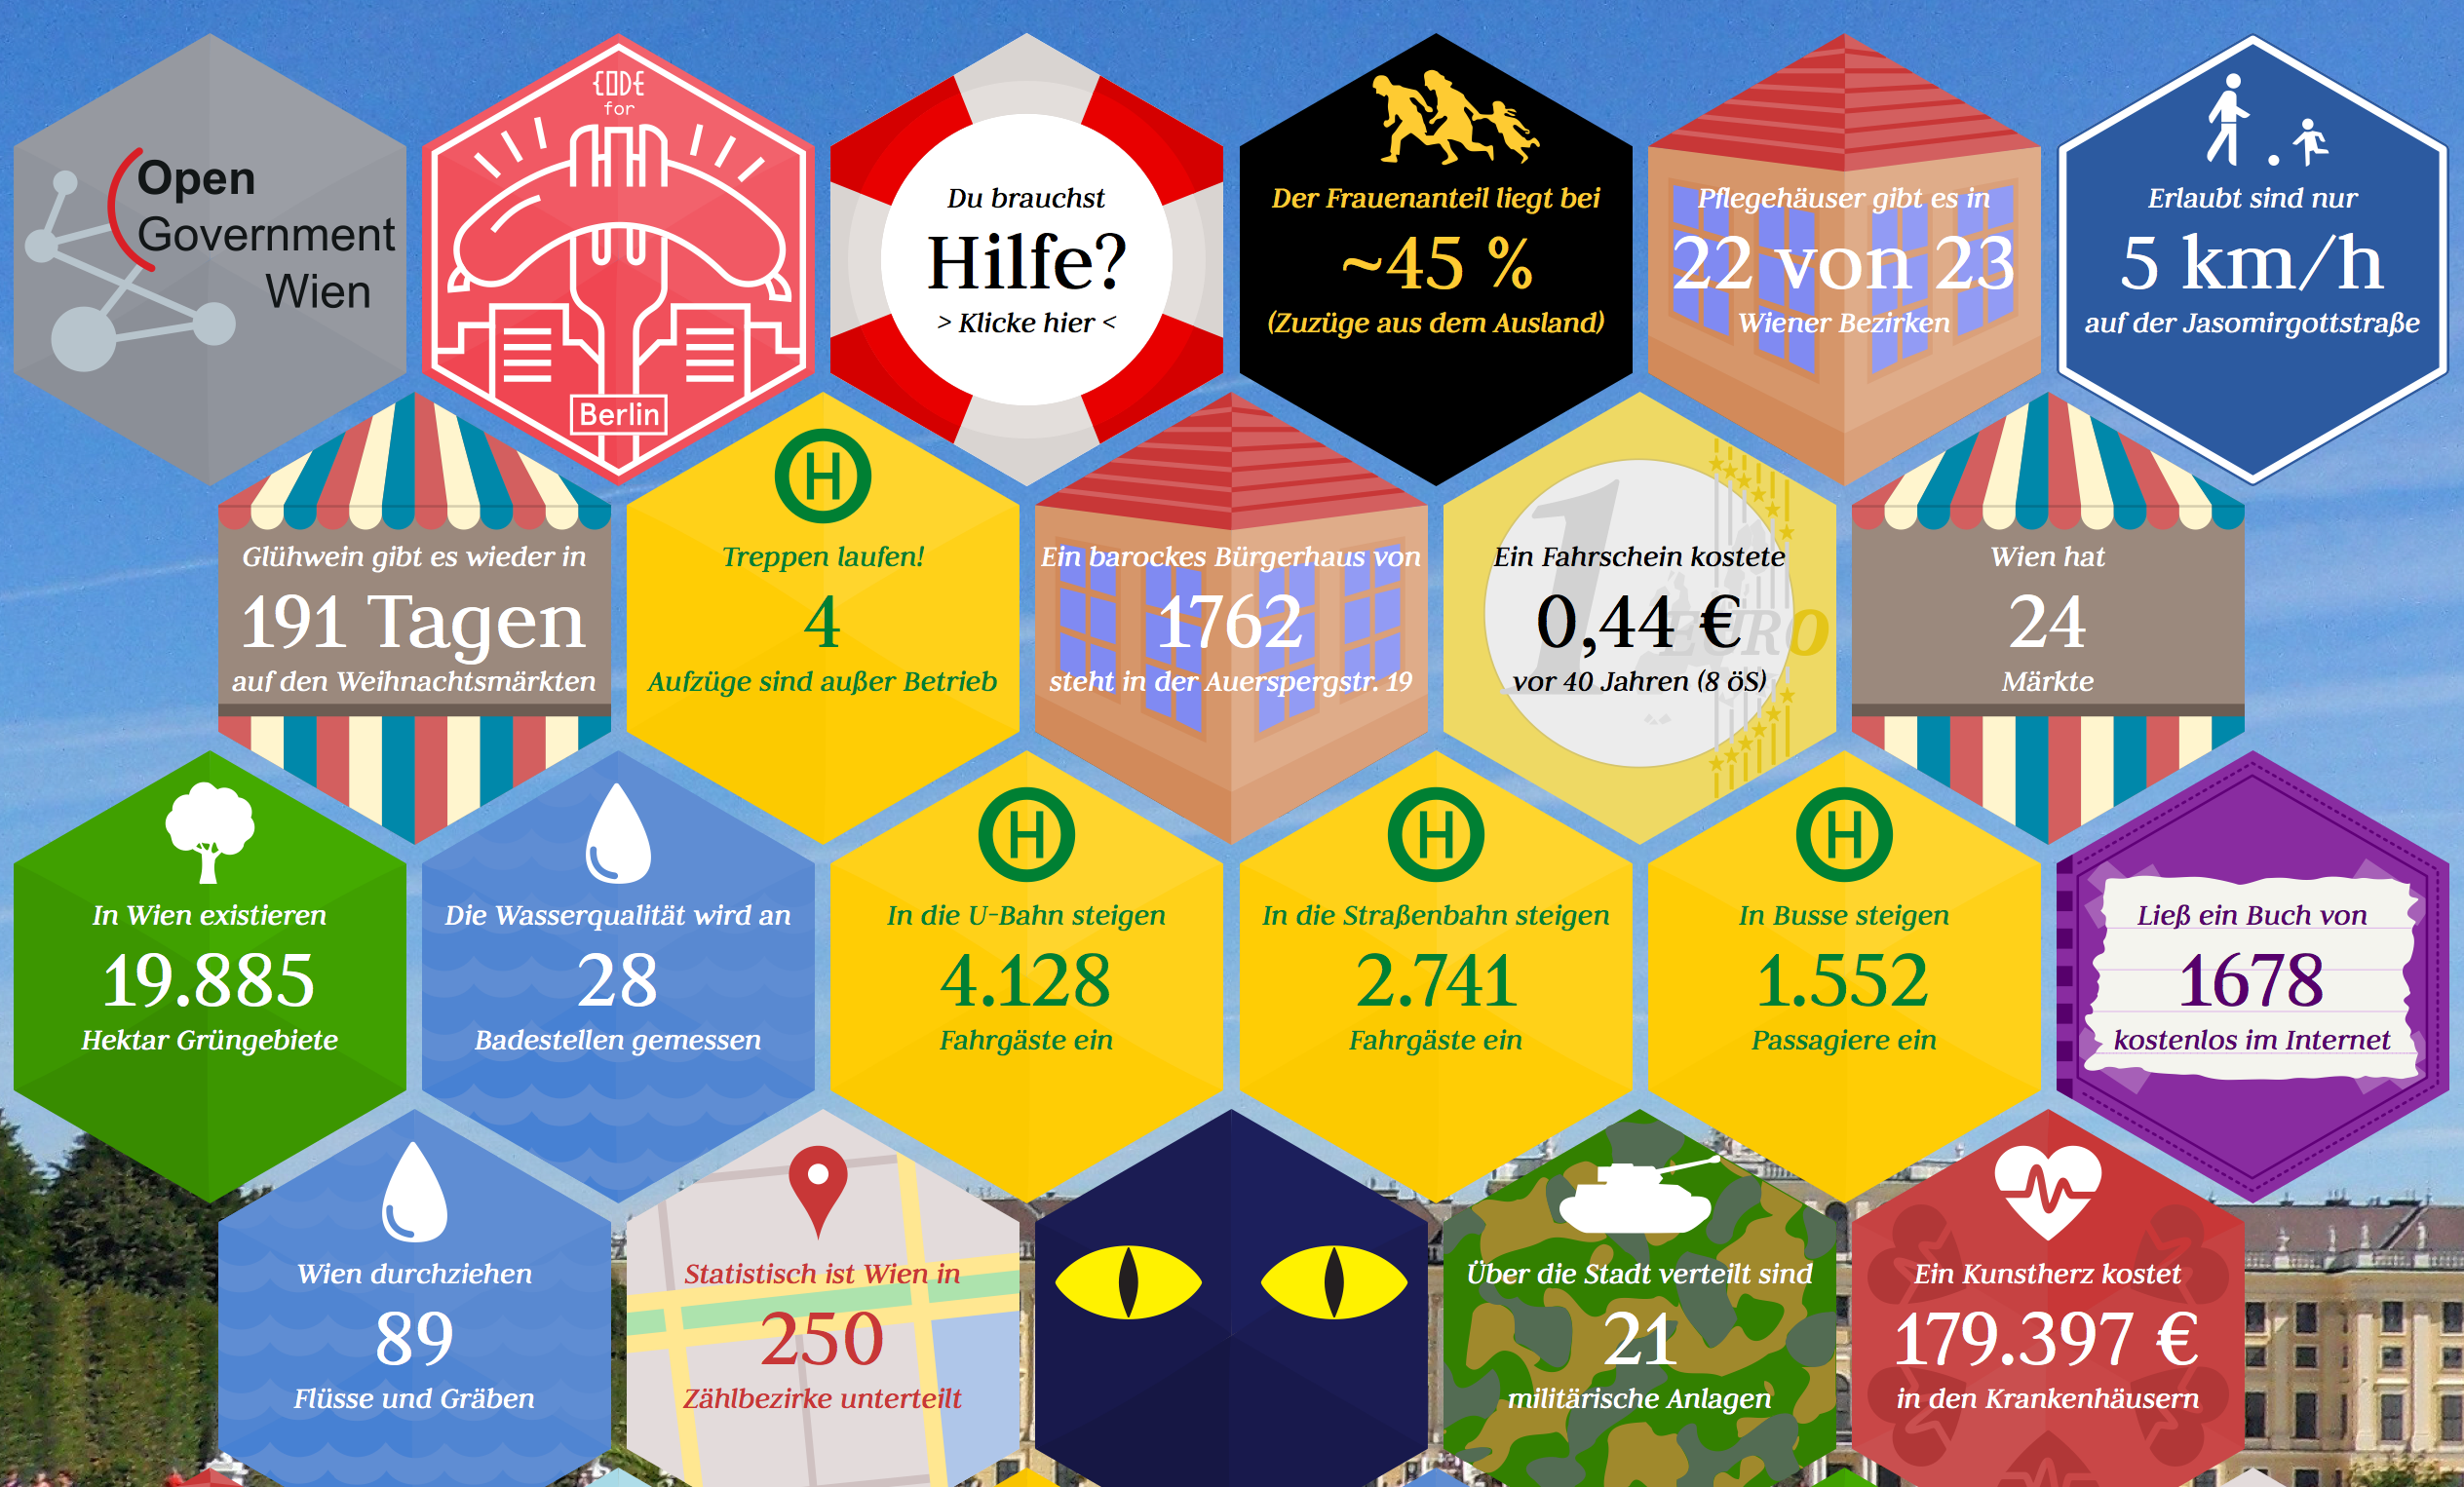
Show an #OpenData data dashboard of various cities. See the result of the visualization.
The 'Datenwaben' online portal aims to visualize the contents of the so far 300 datasets of the 'Open Government Data' initiative in an easy-to-understand manner.
That's a nice summery of this project. I collect many honeycombs from many cities on my website to show the wide range of available datasets. Some people fork this project and create an own version e.g. for Chemnitz, Germany.
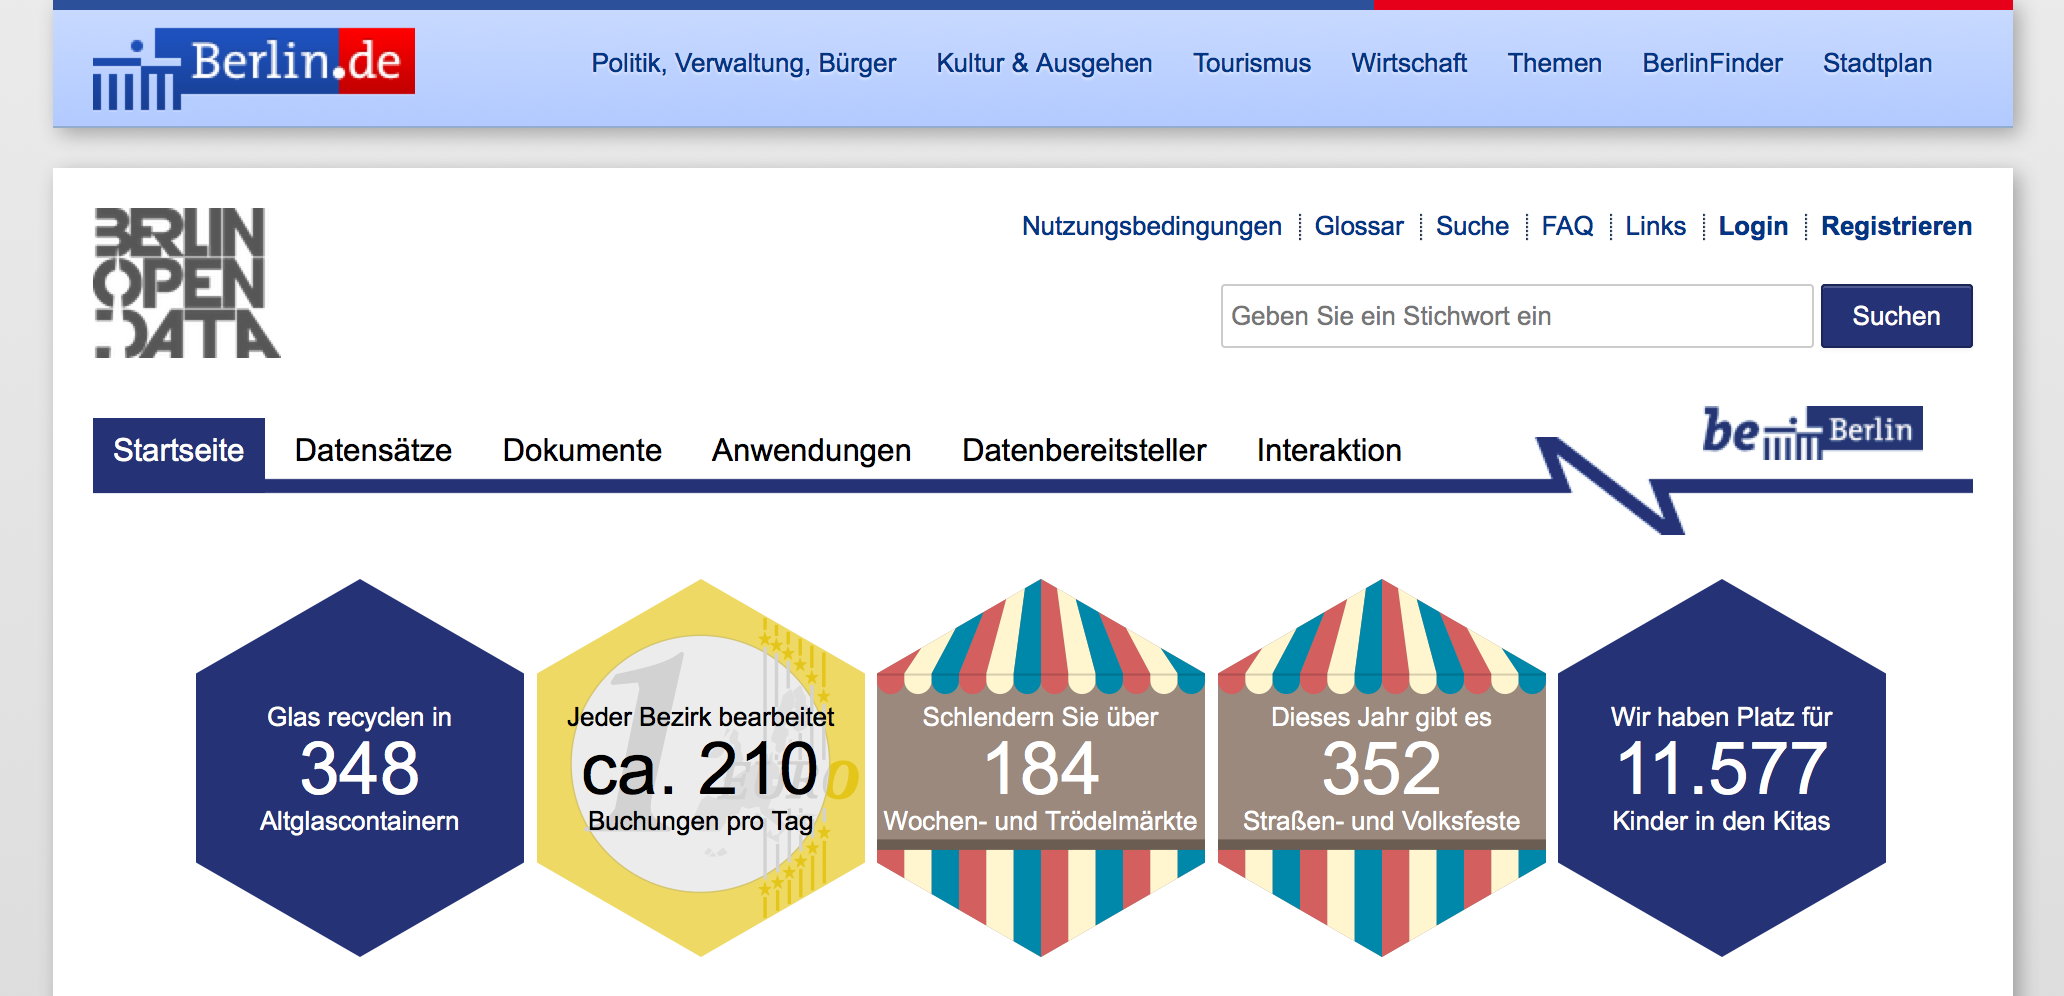
The good guys from Berlin forked this project and build a Drupal 7 module on top of this. As a second step they integrated the data honeycombs project in the front page of the offical Open Data portal of Berlin.
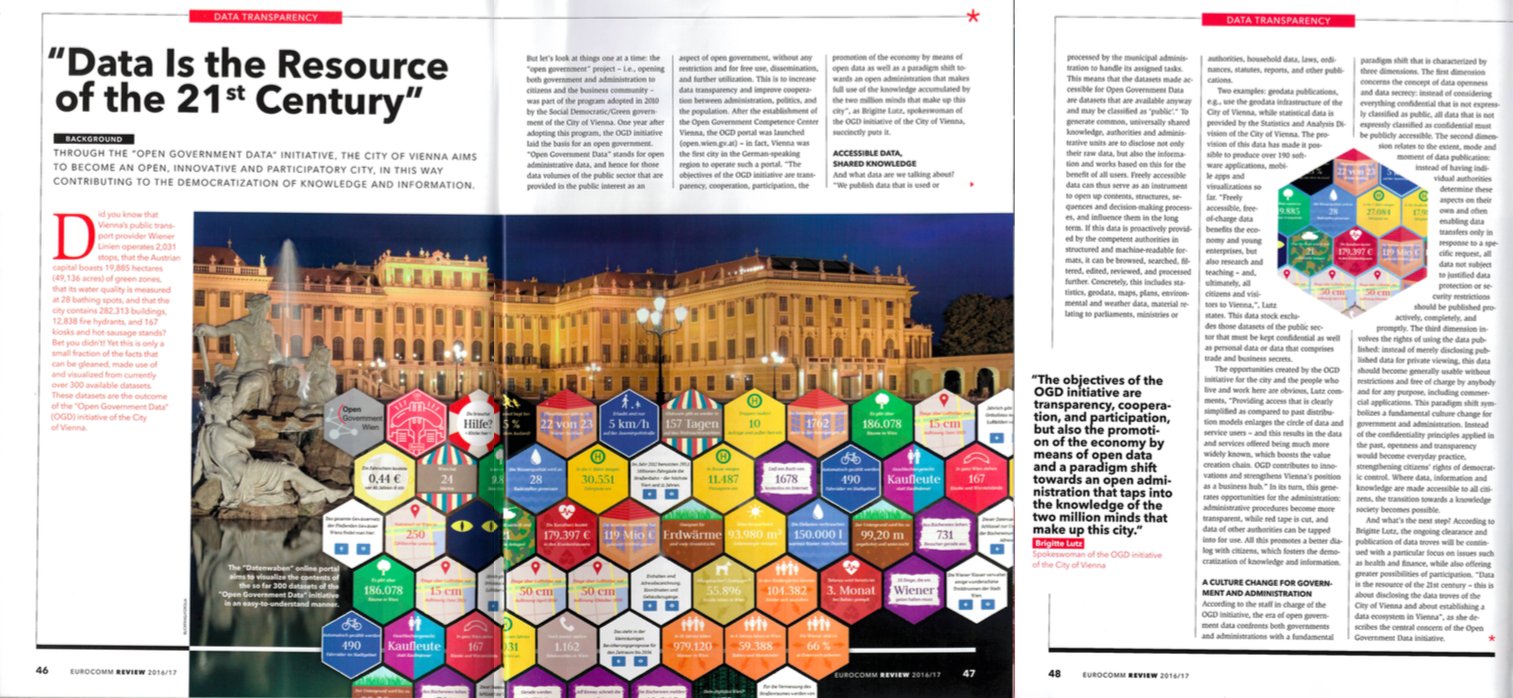
The quote above I've seen in a magazine. So if you want to illustrate data why not this way ;)
You only need a browser to create your own redeployment. This project uses only .HTML, .CSS and .JS files. If this side does not work offline try another browser (e.g. Firefox). I will work on a better solution.
- Create a new city
- Create a new honeycomb
- Create a new background image
- Create a new translation
Since this project only uses .HTML file, you can deploy your copy using gh-pages.
If you have question, ideas, found a bug or just want to hug: mail me, follow me or tweet me.
Copyright 2016 Thomas Tursics. Licensed under the MIT License.


