The objective of a project on Educational Data Analysis for Student Report using Big Data Analytics is to leverage the power of data analytics and mining techniques to identify patterns, insights, and predictive factors that can enhance students' academic performance, improve teaching strategies, and optimize educational processes. Below are specific objectives:
-
Use predictive analytics to identify at-risk students and provide targeted interventions to improve their academic performance.
-
Develop insights into the factors affecting student success, such as attendance, engagement, and learning habits.
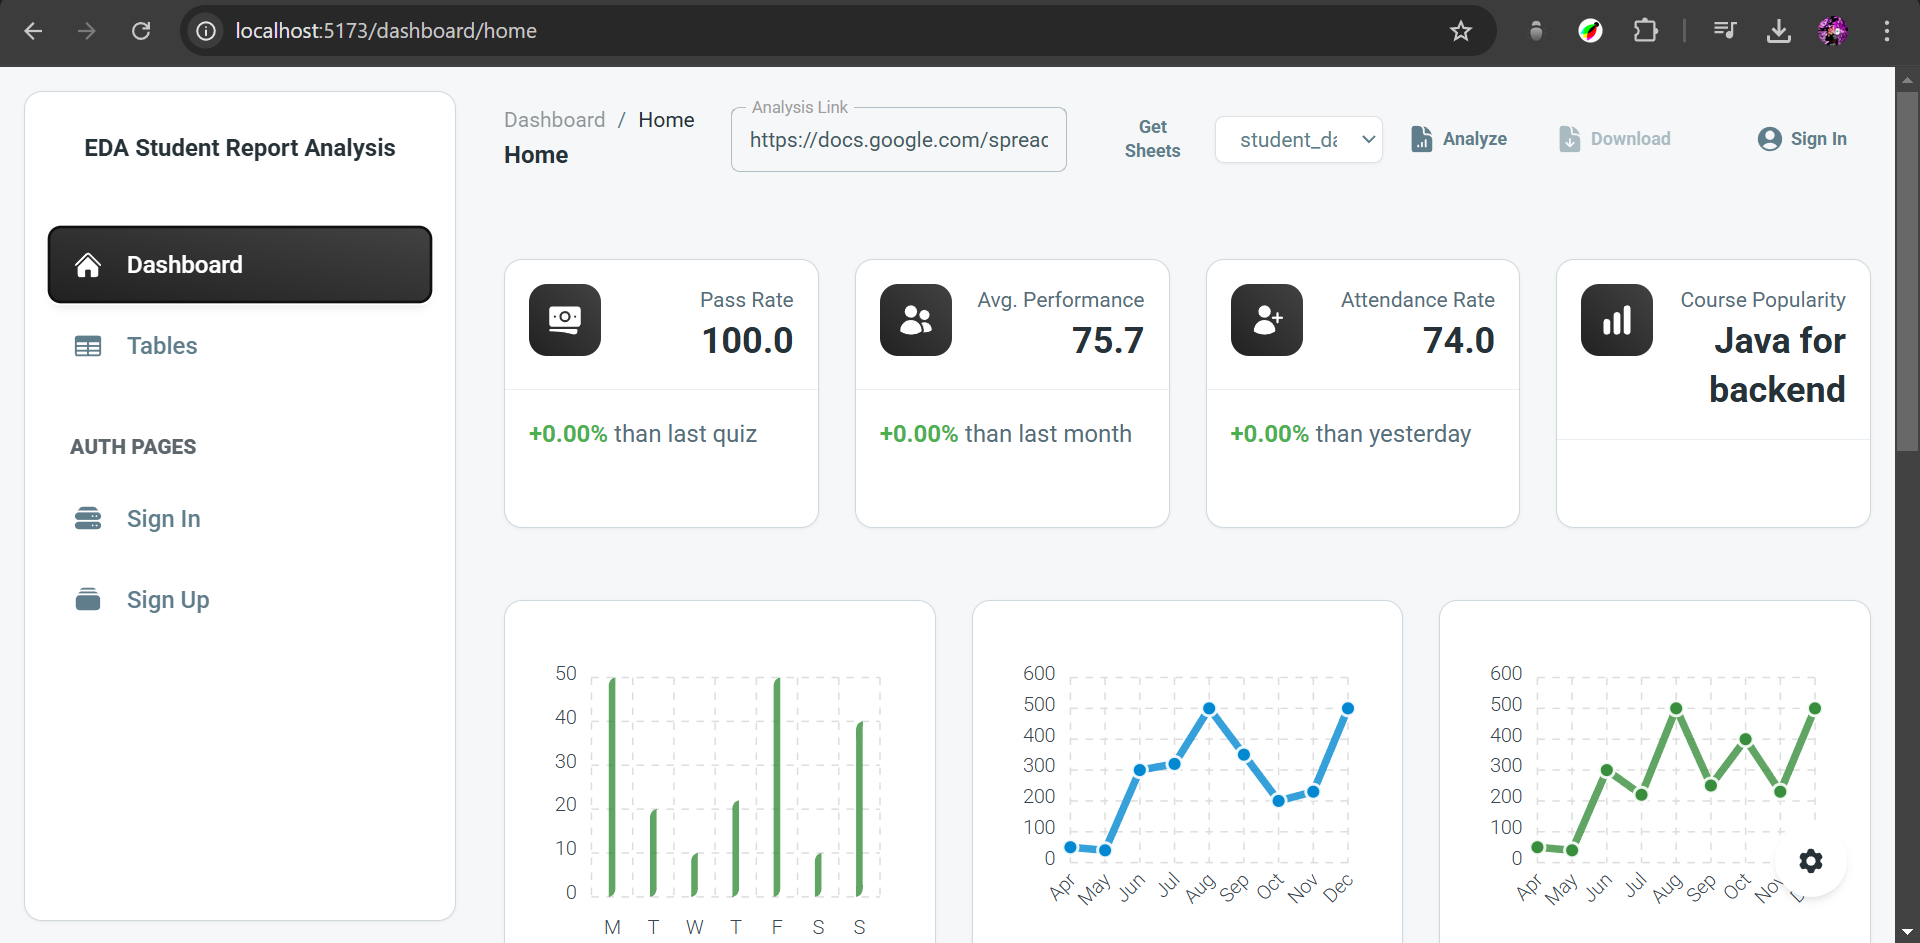
This project is an interactive data visualization dashboard for analyzing student performance, engagement metrics, and course trends using big data analytics and real-time reporting.
- React.js → For building a dynamic and responsive UI.
- Chart.js → Used for interactive bar charts, pie charts, and line graphs.
- React Chart.js 2 → A React wrapper for Chart.js.
- Redux / Context API → Manages global state across the application.
- Material UI (MUI) → For designing sleek UI components.
- Node.js → A lightweight and scalable backend runtime.
- Express.js → A fast and minimal Node.js framework for API development.
- MongoDB → NoSQL database, ideal for handling semi-structured educational data.
- Big Data Integration → Periodic batch or real-time processing for analytics storage.
- Google Data Studio → To generate interactive data reports and dashboards.
- Tableau Public → For advanced visualization and batch data analytics.
1️. Data Ingestion
- Collects raw educational data from sources like databases, CSV, APIs, Excel.
2️. Big Data Processing
- Uses Google Data Studio / Tableau for real-time batch processing.
3️. REST API
- Exposes processed data via RESTful APIs.
4️. Data Visualization
- React components fetch real-time analytics and display them using Chart.js.
5️. Live Dashboard
-
Displays student performance, activity trends, and engagement metrics.
-
-


Postman API Documentation: Coming Soon...
Stay tuned for detailed API endpoints, request methods, and response samples.
Download Major Project Report (PDF): 📄 Download Project Report
A detailed project documentation PDF will be available soon.
1️. Clone the repository:
git clone link cd your-repo-folder
- Install dependencies: npm install
3️. Start the backend server: npm run server
4️. Start the frontend: npm run dev 🚀 The dashboard will be live at http://localhost:5173/