
Bad posture is an ever-prevalent problem amongst people from all age groups in their everyday life. This paper aims to implement an Internet-of-Things solution that enables users to be informed of their sitting habits so that they can correct any bad habits before they manifest themselves as back problems. Our solution provides users with real-time notifications when their sitting posture is incorrect. It also implements long-term analytics to allow users to be better informed of their posture over time. Overall, our solution not only detects erroneous sitting posture with high accuracy, but also energy efficient.
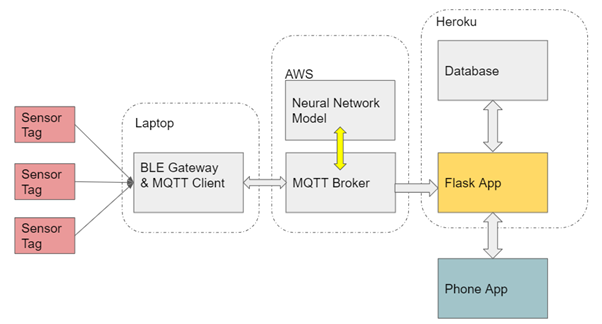
As seen from the figure above, we have a total of 3 sensor tags. The sensor tags send data to our laptop which acts as a BLE gateway and MQTT client. The MQTT client on the laptop communicates with the MQTT Broker on our AWS EC2 instance. This broker then sends data to the Flask application on Heroku using a HTTP PUT request. In addition, we have an Android phone app that uses HTTP GET requests to get charts reflecting a user’s sitting posture. This makes it simple and easy for the users to view their sitting posture habits.
TI CC2650 SensorTag The SensorTag was programmed to generate quaternion values based on the readings from the accelerometer and the gyroscope in the MPU9250 unit. It also implements a customized BLE service which handles relay of quaternion values to the BLE client connected to the Sensortag. 3 Sensortags are attached at the neck, middle back and lower back via a shirt and a neck strap that the user can wear. These positions allow us to collect data about the spine of the user. Quaternion BLE Service A customized BLE service is designed to transmit the quaternion data from the BLE sensortag to the BLE gateway in a practical manner. While the design takes heavy reference from the MPU9250 movement service, it is heavily modified to transmit a leaner payload. BLE Gateway The gateway enables simultaneous connection to multiple sensortags. It then synchronises the collection of data from the connected sensors to perform updates either to a CSV file for collection of training data, or to the backend server for prediction. The gateway also notifies the buzzing sensortag to activate the buzzer whenever the user is detected to be sitting in an incorrect posture. This is performed via the corresponding BLE notifications to the middle back sensor, which we assign to be the sole buzzing sensor.
High level logic The gateway uses the Python Asyncio Library to coordinate multiple connections on different tasks running asynchronously. The Event flag class from the same library was also used heavily in order to ensure that sensor data from the different sensortags are synchronised and collected in the same instant of time. The gateway uses the bleak library to implement BLE connections with the multiple sensortags. When initialised, the gateway will scan for relevant BLE addresses corresponding to the various sensors. When all relevant sensors are detected, the gateway then gathers multiple run threads for each device. If a disconnection occurs, the gateway catches the exception and repeats the process of scan-then-connect. If the gateway is in data collection mode, sensor data is appended to a CSV file. If the gateway is in real time prediction mode, the sensor data is communicated to the backend server on the CLASSIFY topic.
Backend Server - Machine Learning The MQTT broker is deployed on an AWS EC2 instance. It receives the quaternions from the MQTT client (which is also the gateway), loads the machine learning model, and returns the real-time classification from the machine learning model.
Backend Server - Long term analytics
The MQTT broker sends PUT requests to the Flask application once it gets new data from the MQTT client. Flask is a micro web framework written in Python. Using Heroku addons, we create a PostgreSQL database and use Flask-SQLAlchemy to access the database easily.

As shown in the figure above, the database contains the user’s name, timestamp of the reading and the classification of that reading. The Flask API we have created consists of many functions, aimed at generating plots that are easy to understand.
The full list of functions are as follows:
- Adding data to database:
PUT - Visualising data from the database:
GET - Get stack bar plot with dates:
GET - Get stack bar plot with dates, but only showing bad posture:
GET - Get stack bar plot with hours:
GET - Get stack bar plot with hours, all time record:
GET - Get stack bar plot with hours, but only showing bad posture:
GET - Get stack bar plot with hours, but only showing bad posture, all time record:
GET - Get pie chart plot showing percentages of each classification:
GET - Get pie chart plot showing percentages of each classification, all time record:
GET - Get last lag number of entries from the database:
GET - Delete all the data of a given name:
DELETE
Examples of the plots are shown in the figures below.
 \
\
These plots are then written into Python’s BytesIO objects, then into base64 strings which are given to the mobile app.
Mobile app
The mobile app is created so that users are able to conveniently access the analytics from their phone. The user interface of the app is also made to be simple to allow users to be able to navigate through the app with ease.
The mobile app is able to retrieve data from the heroku database using GET requests as shown in section 4.4. For GET requests involving dates, the time is retrieved from the system using Java and is then converted to python format and sent as a parameter to the GET request. A new thread has to be created for every GET request. This is due to the nature of android studio which does not allow internet functions to be programmed into the same thread as the app.
There are 2 kinds of analytics that users are able to view in the app, the long term and the short term analytics. The long term analytics includes pie charts and bar charts of every data related to the user in the heroku database. The short term analytics also includes the pie and bar charts but they only visualize the previous 7 days of available data found in the Heroku database.

Figure 14 shows an example of a pie chart, The bar chart is similar to this user interface. Users will have to press the refresh button to update the charts if new data has been added to the Heroku database. Additionally, users are able to view the latest 3 data uploaded to the heroku server in the short term analytics in text format. Figure 15 shows the format of the raw data shown in the app.
- I improved on the BLE gateway code, using Bleak to get the data from the sensortags. Used python’s async io. This was particularly hard because I never used this before, the previous solution had duplicate rows of data because it was not able to ensure that all the data collection ran concurrently. Then I had to use various Event flags with the coroutines to coordinate and synchronise the data collection. When all relevant sensors are detected, the gateway then gathers multiple run threads for each device. If a disconnection occurs, it catches the exception and repeats the process of scan-then-connect.
- I created the code for the paho mqtt python client to code the communication between the mqtt client and server. Get the data into a payload, publish it to a topic and subscribe to the topic.
- I created the Flask application API to get multiple graphs for analysis, such as the time spent in each posture.