Publication-quality alignment viewer for nucleotide and amino acid sequences. A lightweight alternative to samtools tview that produces clean, stable image output.
Supports BAM files (with reference FASTA), pre-aligned FASTA (e.g. MAFFT output), and stacking multiple inputs into a single figure.
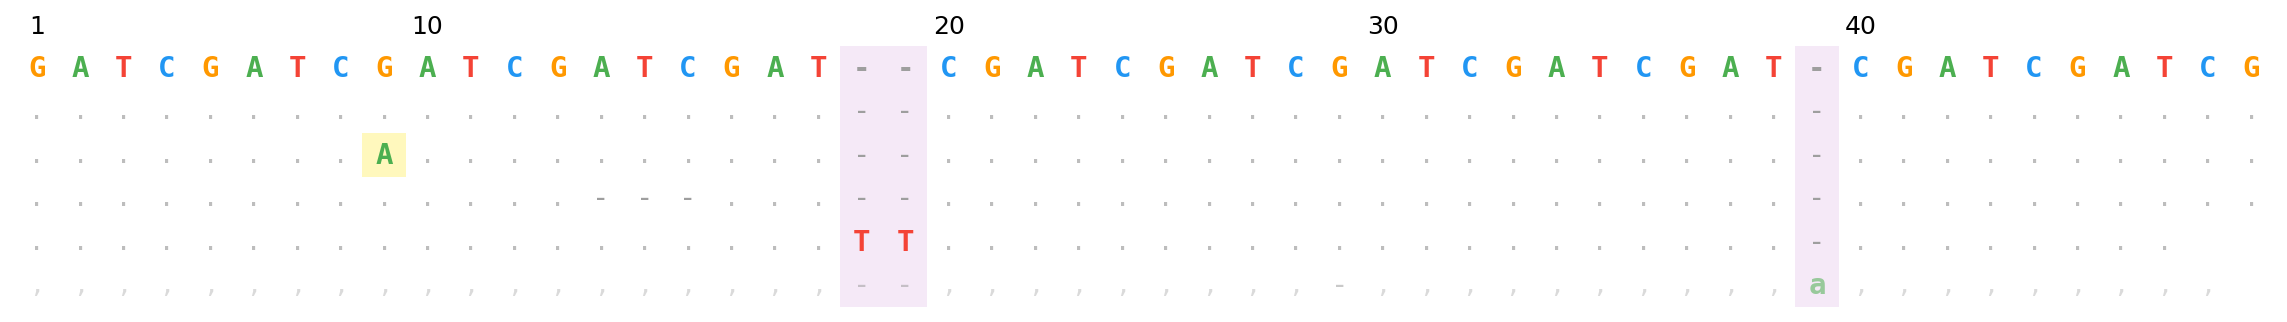 BAM mode — SNP (yellow), 3bp deletion, 2bp insertion (purple columns), reverse-strand insertion
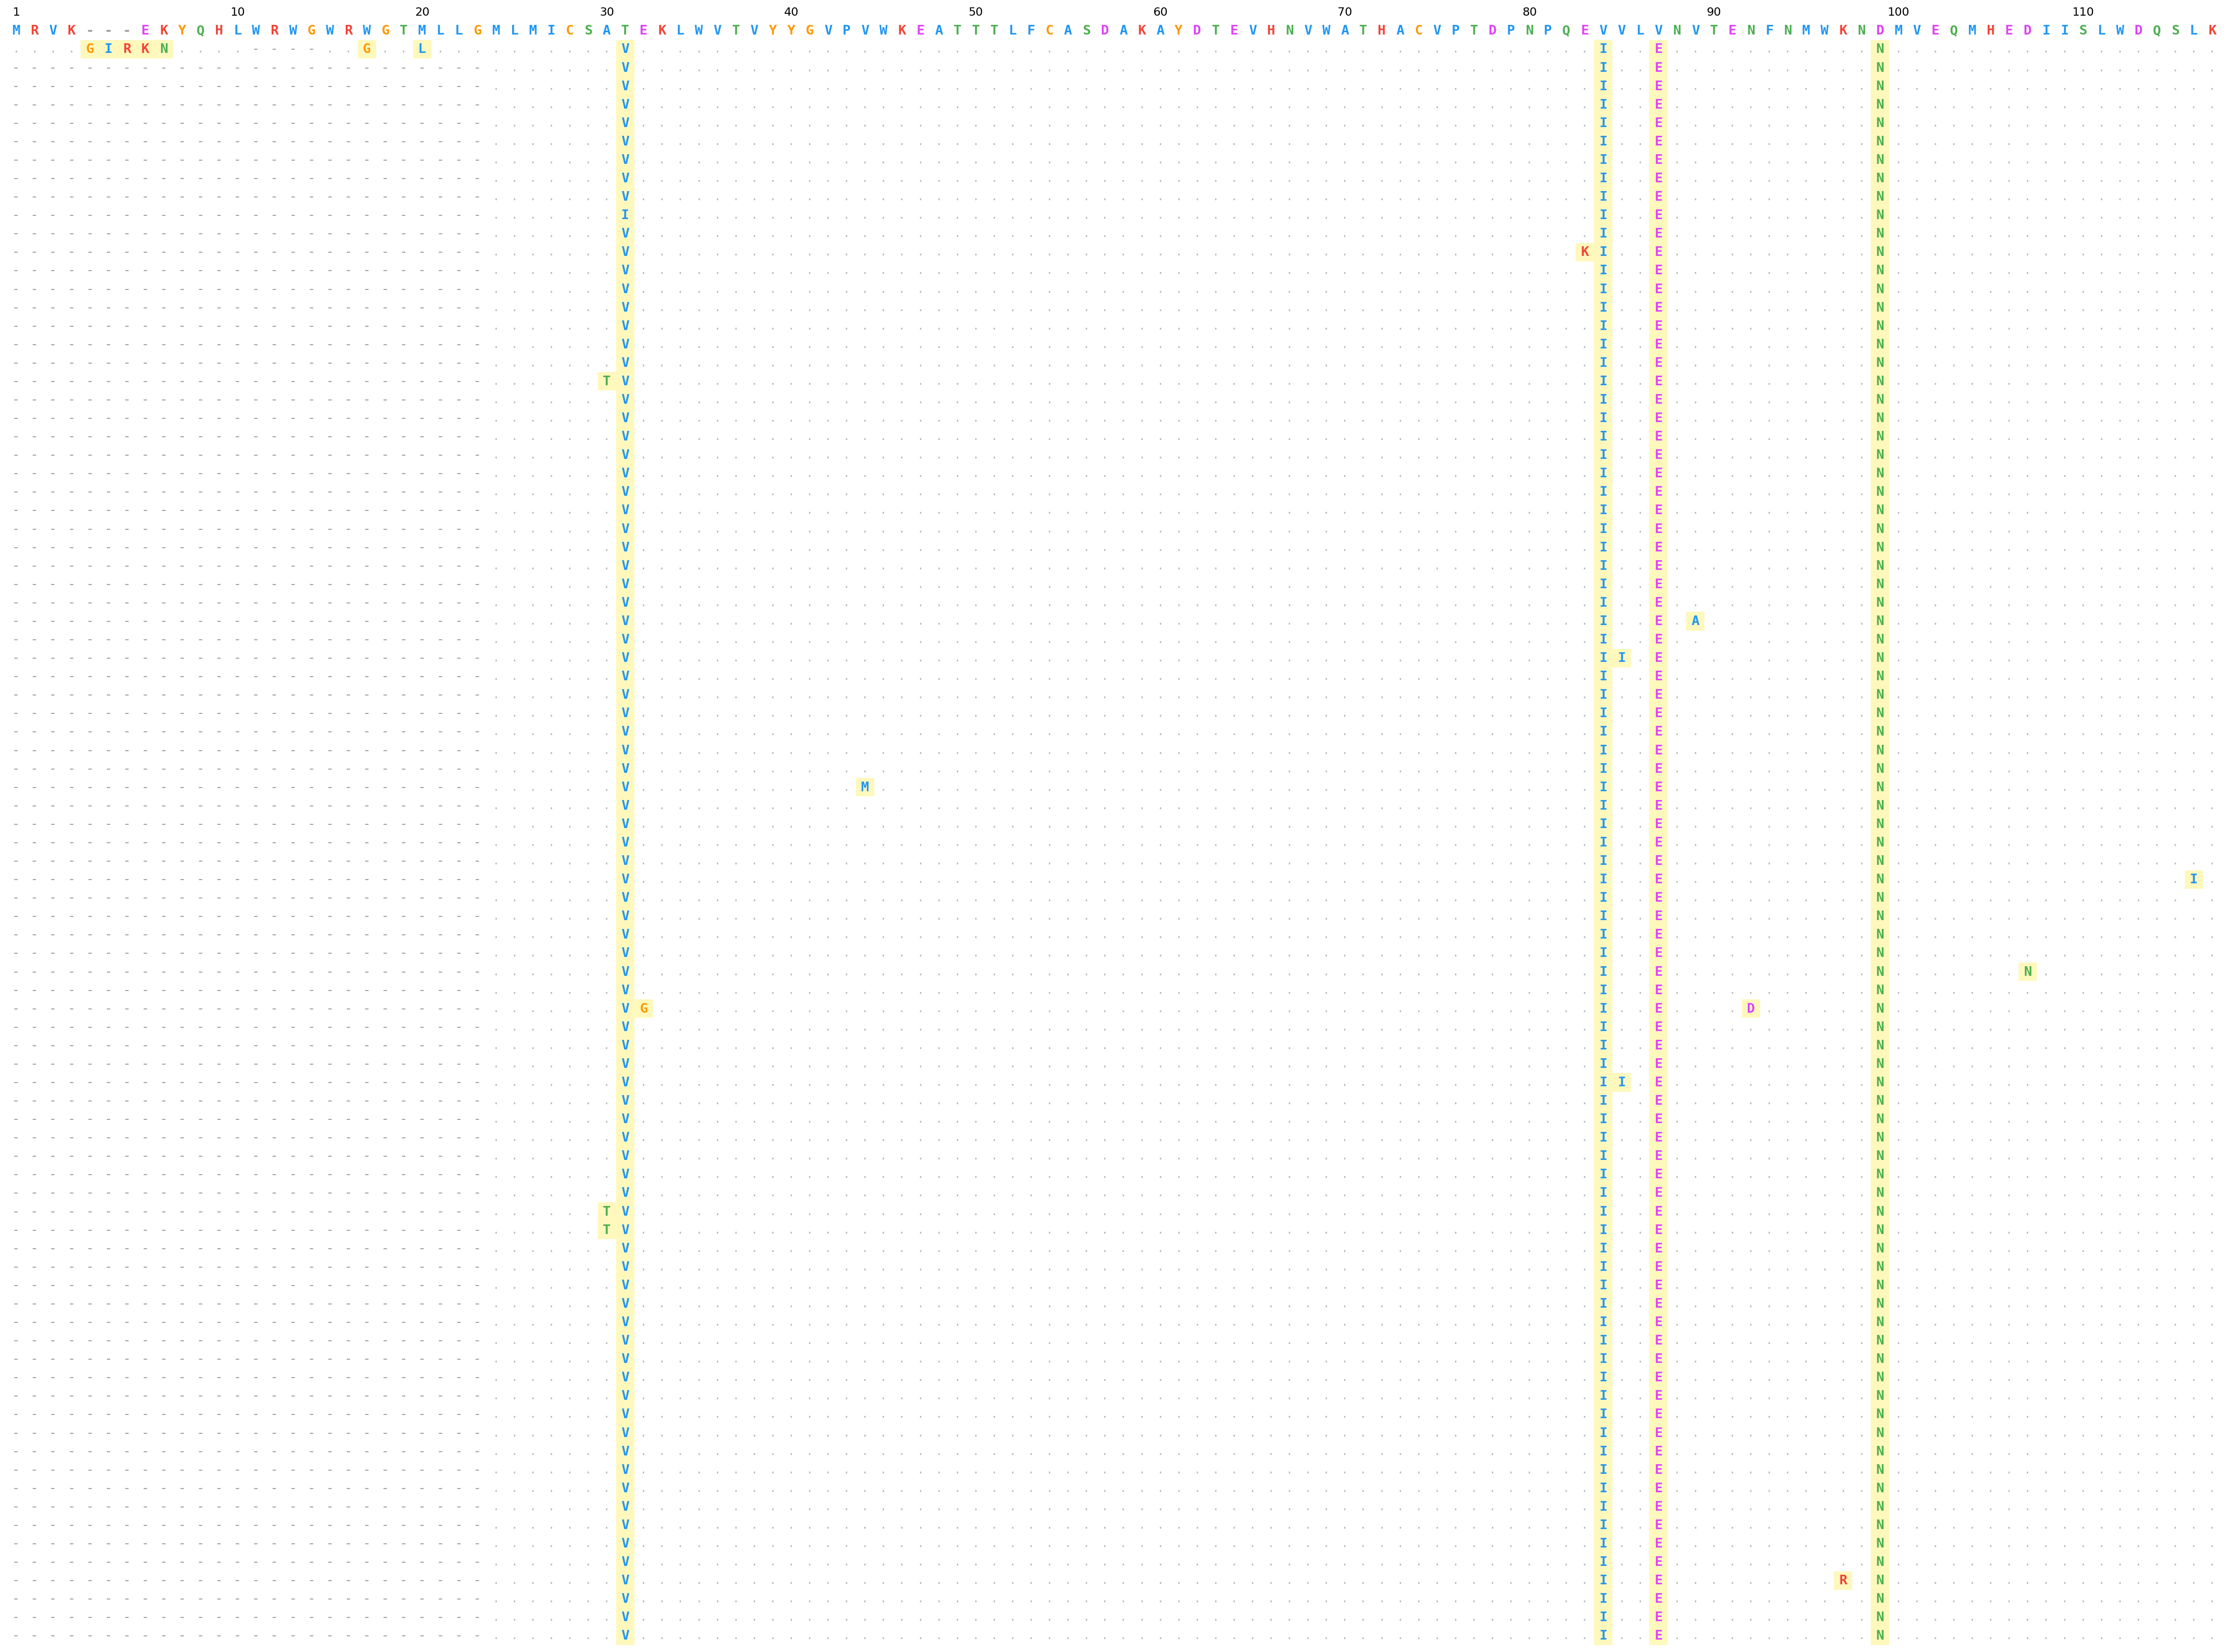 FASTA mode — HIV Env protein alignment (HxB2 reference), amino acid palette
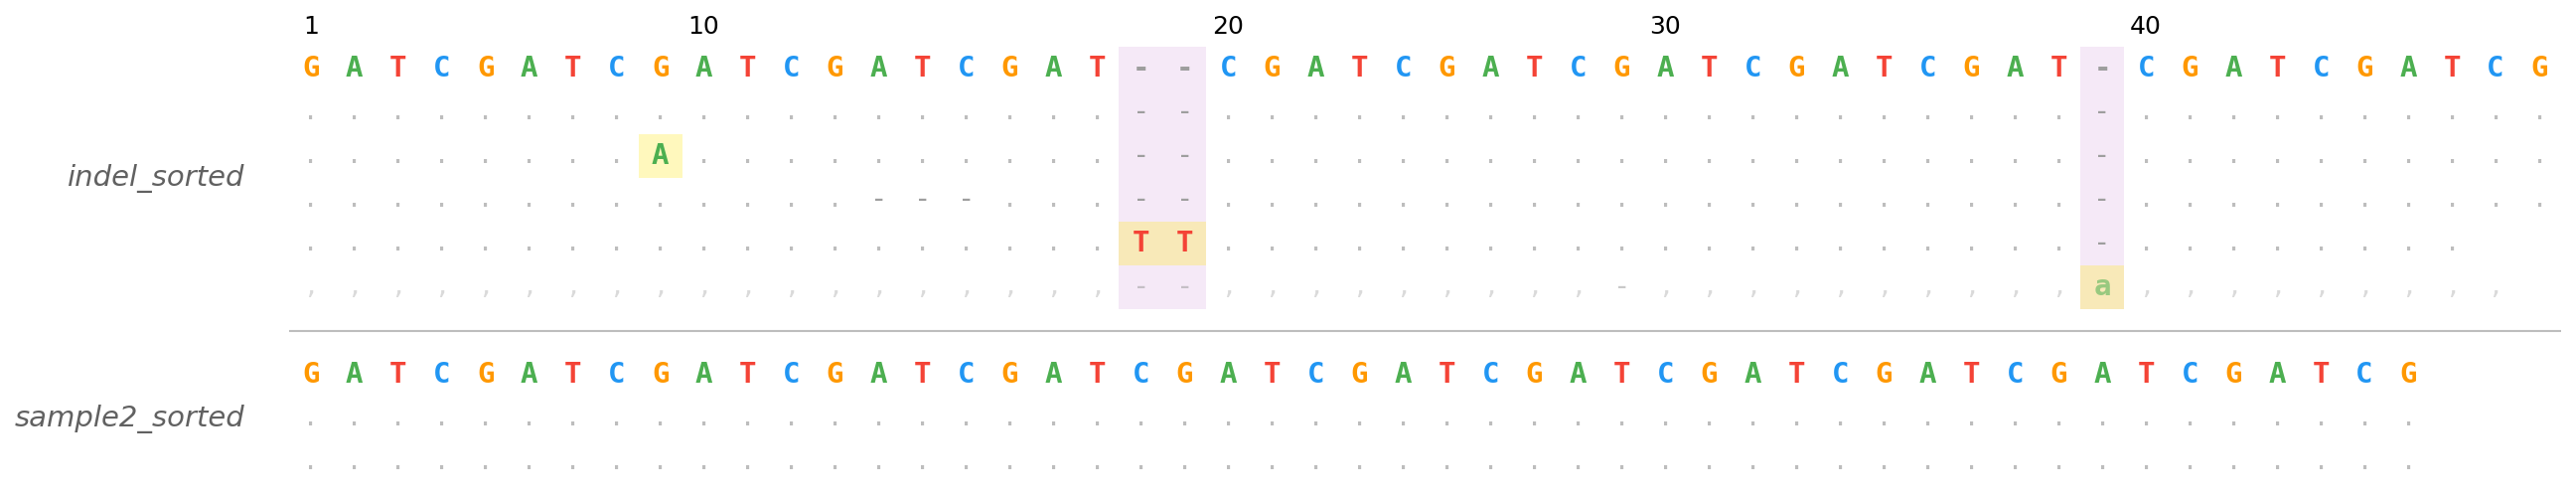 Stacked mode — two BAM files sharing a reference and region
 Classic mode — black-and-white rendering for textbook-style figures and grayscale print
pip install tviewInstalls matplotlib, click, and pysam.
tview \
  --bam aligned.bam \
  --ref reference.fa \
  --region chr1:100-200 \
-o alignment.pngThe first sequence in the file is treated as the reference.
tview \
  --fasta env_protein_aligned.fasta \
  --palette aa \
-o env_alignment.pngUse --columns with 1-based inclusive range to window into long alignments.
tview \
  --fasta aligned.fasta \
  --columns 1-120 \
  --palette aa \
-o first_120_cols.pngUse --classic-mode for textbook-style monochrome output — all black text on a white background with no colored highlighting. Structural conventions (. , lowercase, -) are preserved.
tview \
  --fasta aligned.fasta \
  --palette aa \
  --classic-mode \
-o classic_output.pngEach input file becomes a vertically stacked panel separated by a thin line. Panels are labeled on the left with the filename stem.
tview \
  --bam sample1.bam --bam sample2.bam --bam sample3.bam \
  --ref reference.fa \
  --region chr1:100-200 \
-o stacked.pngtview \
--fasta group1_aligned.fasta --fasta group2_aligned.fasta \
--palette aa \
--columns 1-120 \
-o comparison.png--ref and --region apply only to BAM panels; --columns applies only to FASTA panels.
tview \
  --bam reads.bam \
  --ref reference.fa \
  --region chr1:100-200 \
  --fasta protein_aligned.fasta \
  --columns 1-120 \
  -o mixed.png
BAM panels are rendered first (top), FASTA panels below.
Pass - to read file paths from stdin (one per line). Each path becomes its own panel.
# find → stacked panels
find ./alignments -name "*.fasta" -type f | \
  tview --fasta - --palette aa --columns 1-120 -o all.png

# ls with pattern
ls samples/*.bam | \
  tview --bam - --ref ref.fa --region chr1:100-200 -o all_samples.png

# single file via echo
echo "my_alignment.fasta" | \
tview --fasta - --palette aa -o out.pngThe core functions are available as a Python library:
from tview import fasta_panel, bam_panel, render_panels

# FASTA alignment
panel = fasta_panel("aligned.fasta", columns=list(range(1, 121)))
render_panels([panel], "output.png", palette="aa")

# BAM alignment
panel = bam_panel("sample.bam", "reference.fa", "chr1:100-200")
render_panels([panel], "output.png")

# Stack multiple panels
panels = [
    bam_panel("sample1.bam", "ref.fa", "chr1:100-200"),
    bam_panel("sample2.bam", "ref.fa", "chr1:100-200"),
]
render_panels(panels, "stacked.png", dpi=300, fontsize=7, cell=0.14)

# Classic (black-and-white) mode
panel = fasta_panel("aligned.fasta")
render_panels([panel], "classic.png", palette="aa", classic=True)draw_panels() and panel_figsize() let you draw alignments onto any
matplotlib axes, including patchworklib
Brick objects for composing multi-panel figures.
pip install patchworklib
# or
pip install tview[compose]
import patchworklib as pw
from tview import fasta_panel, draw_panels, panel_figsize
# Build alignment panel
panel = fasta_panel("aligned.fasta", columns=list(range(1, 121)))
w, h = panel_figsize([panel], fontsize=7, cell=0.14)
# Draw onto a patchworklib Brick
alignment = pw.Brick(label="alignment", figsize=(w, h))
draw_panels([panel], ax=alignment, fontsize=7, palette="aa", cell=0.14)
# Compose with other plots
scatter = pw.Brick(label="scatter", figsize=(3, 3))
scatter.scatter([1, 2, 3], [4, 5, 6])
layout = alignment / scatter # vertical stack
layout.savefig("composed.png")This also works with standard matplotlib subplots:
import matplotlib.pyplot as plt
from tview import fasta_panel, draw_panels, panel_figsize

panel = fasta_panel("aligned.fasta")
w, h = panel_figsize([panel])
fig, (ax1, ax2) = plt.subplots(1, 2, figsize=(w + 4, max(h, 3)))

draw_panels([panel], ax1, palette="aa")
ax2.scatter([1, 2, 3], [4, 5, 6])

plt.tight_layout()
plt.savefig("side_by_side.png", dpi=300, bbox_inches="tight")| Element | Symbol | Style |
|---|---|---|
| Match (forward) | . |
light grey |
| Match (reverse) | , |
light grey, reduced opacity |
| Mismatch | A T etc. |
colored, yellow highlight, bold |
| Mismatch (reverse) | a t etc. |
lowercase, colored, yellow highlight |
| Deletion | - |
grey dash |
| Insertion | colored bases | purple column shading |
| Gap (ref in insertion col) | - |
grey dash |
| Gap (FASTA alignment) | - |
grey dash |
| Base | Color |
|---|---|
| A | green #4CAF50 |
| C | blue #2196F3 |
| G | orange #FF9800 |
| T | red #F44336 |
| Group | Residues | Color |
|---|---|---|
| Hydrophobic | A V L I M F W P | blue #2196F3 |
| Positive charge | K R H | red #F44336 |
| Negative charge | D E | magenta #E040FB |
| Polar uncharged | S T N Q | green #4CAF50 |
| Special | G C Y | orange #FF9800 |
Usage: tview [OPTIONS]

  Publication-quality alignment viewer (BAM or FASTA).

Options:
  --bam TEXT              BAM file(s) — each becomes a panel. Use '-' for stdin.
  --ref PATH              Reference FASTA (required for BAM mode).
  --region TEXT            Genomic region chr:start-end (required for BAM mode).
  --fasta TEXT             Aligned FASTA file(s) — each becomes a panel. Use '-' for stdin.
  --columns TEXT           Column range for FASTA, 1-based inclusive (e.g. 1-120).
  -o, --output TEXT        Output image path.  [default: alignment.png]
  --palette [nt|aa]        Color palette.  [default: nt]
  --dpi INTEGER            Image resolution.  [default: 300]
  --fontsize INTEGER       Base font size in points.  [default: 7]
  --cell FLOAT             Cell size in inches.  [default: 0.14]
  --classic-mode           Black-and-white rendering with no color highlighting.
  -h, --help               Show this message and exit.
| Argument | Description | Default |
|---|---|---|
--bam |
BAM file(s), each becomes a panel. Use - for stdin. |
— |
--ref |
Reference FASTA (required for BAM mode) | — |
--region |
Genomic region chr:start-end (required for BAM) |
— |
--fasta |
Aligned FASTA file(s), each becomes a panel. Use - for stdin. |
— |
--columns |
Column range for FASTA, 1-based inclusive (e.g. 1-120) |
full alignment |
-o, --output |
Output image path | alignment.png |
--palette |
Color palette: nt or aa |
nt |
--dpi |
Image resolution | 300 |
--fontsize |
Base font size in points | 7 |
--cell |
Cell size in inches (controls spacing) | 0.14 |
--classic-mode |
Black-and-white rendering with no color highlighting | False |
- Use
--dpi 300(default) for print,--dpi 150for drafts. - Use
--cell 0.10for denser layouts with many sequences,--cell 0.18for fewer. - Use
--fontsize 5or6when displaying wide alignments (>100 columns). - The output format is determined by the file extension:
.png,.pdf,.svgall work. - For Nature-style figures,
.pdfor.svgoutput preserves vector text. - Use
--classic-modefor textbook-style monochrome figures that reproduce well in grayscale print.
# Vector output for publication
tview \
  --fasta aligned.fasta \
  --palette aa \
  --columns 1-120 \
  --cell 0.12 \
  --fontsize 6 \
-o figure_2a.pdfThe FASTA input must be pre-aligned (e.g. by MAFFT, MUSCLE, Clustal). The first sequence is used as the reference for comparison. Gap characters (-) in the alignment are preserved and rendered as grey dashes.
>HxB2_reference
MRVK---EKYQHLWRWGWRWGTMLLGMLMICS...
>sample_001
MRVKGIRKNAQHL----WRGGTLLLGMLMICS...
>sample_002
--------------------------MLMICS...
The x-axis labels count non-gap positions in the reference sequence (1, 10, 20, ...), so position numbers always correspond to the reference residue numbering regardless of gap columns.