forked from egeulgen/pathfindR
-
Notifications
You must be signed in to change notification settings - Fork 0
Expand file tree
/
Copy pathREADME.Rmd
More file actions
212 lines (141 loc) · 12.5 KB
/
Copy pathREADME.Rmd
File metadata and controls
212 lines (141 loc) · 12.5 KB
1
2
3
4
5
6
7
8
9
10
11
12
13
14
15
16
17
18
19
20
21
22
23
24
25
26
27
28
29
30
31
32
33
34
35
36
37
38
39
40
41
42
43
44
45
46
47
48
49
50
51
52
53
54
55
56
57
58
59
60
61
62
63
64
65
66
67
68
69
70
71
72
73
74
75
76
77
78
79
80
81
82
83
84
85
86
87
88
89
90
91
92
93
94
95
96
97
98
99
100
101
102
103
104
105
106
107
108
109
110
111
112
113
114
115
116
117
118
119
120
121
122
123
124
125
126
127
128
129
130
131
132
133
134
135
136
137
138
139
140
141
142
143
144
145
146
147
148
149
150
151
152
153
154
155
156
157
158
159
160
161
162
163
164
165
166
167
168
169
170
171
172
173
174
175
176
177
178
179
180
181
182
183
184
185
186
187
188
189
190
191
192
193
194
195
196
197
198
199
200
201
202
203
204
205
206
207
208
209
210
211
212
---
output: github_document
---
<!-- README.md is generated from README.Rmd. Please edit that file -->
```{r, include = FALSE}
knitr::opts_chunk$set(collapse = TRUE,
comment = "#>",
fig.path = "inst/extdata/",
out.width = "100%")
suppressPackageStartupMessages(library(pathfindR))
```
# <img src="https://github.com/egeulgen/pathfindR/blob/master/inst/extdata/logo.png?raw=true" align="left" height=150/> pathfindR: An R Package for Enrichment Analysis Utilizing Active Subnetworks
<!-- badges: start -->
[](https://travis-ci.com/egeulgen/pathfindR)
[](https://codecov.io/gh/egeulgen/pathfindR)
[](https://cran.r-project.org/package=pathfindR)
[](https://cran.r-project.org/package=pathfindR)
[](https://www.tidyverse.org/lifecycle/#stable)
[](https://opensource.org/licenses/MIT)
<!-- badges: end -->
# Overview
`pathfindR` is a tool for enrichment analysis via active subnetworks. The package also offers functionalities to cluster the enriched terms and identify representative terms in each cluster, to score the enriched terms per sample and to visualize analysis results.
The functionalities of pathfindR is described in detail in _Ulgen E, Ozisik O, Sezerman OU. 2019. pathfindR: An R Package for Comprehensive Identification of Enriched Pathways in Omics Data Through Active Subnetworks. Front. Genet. [https://doi.org/10.3389/fgene.2019.00858](https://doi.org/10.3389/fgene.2019.00858)_
For detailed documentation, see [pathfindR's website](https://egeulgen.github.io/pathfindR/) or [the pathfindR wiki](https://github.com/egeulgen/pathfindR/wiki).
# Installation
You can install the released version of pathfindR from CRAN via:
```{r installation1, eval=FALSE}
install.packages("pathfindR")
```
or via [pak](https://pak.r-lib.org/) (this might be preferable given `pathfindR`'s Bioconductor dependencies):
```{r installation2, eval=FALSE}
install.packages("pak") # if you have not installed "pak"
pak::pkg_install("pathfindR")
```
And the development version from GitHub via [pak](https://pak.r-lib.org/):
```{r installation3, eval=FALSE}
install.packages("pak") # if you have not installed "pak"
pak::pkg_install("egeulgen/pathfindR")
```
> **IMPORTANT NOTE**
> For the active subnetwork search component to work, the user must have [Java (>= 8.0)](https://www.java.com/en/) installed and path/to/java must be in the PATH environment variable.
We also have docker images available on [Docker Hub](https://hub.docker.com/repository/docker/egeulgen/pathfindr) and on [GitHub](https://github.com/egeulgen/pathfindR/packages):
```{bash docker, eval = FALSE}
# pull image for latest release
docker pull egeulgen/pathfindr:latest
# pull image for specific version (e.g. 1.4.1)
docker pull egeulgen/pathfindr:1.4.1
# pull image for latest development version
docker pull egeulgen/pathfindr:dev
```
# Enrichment Analysis with pathfindR
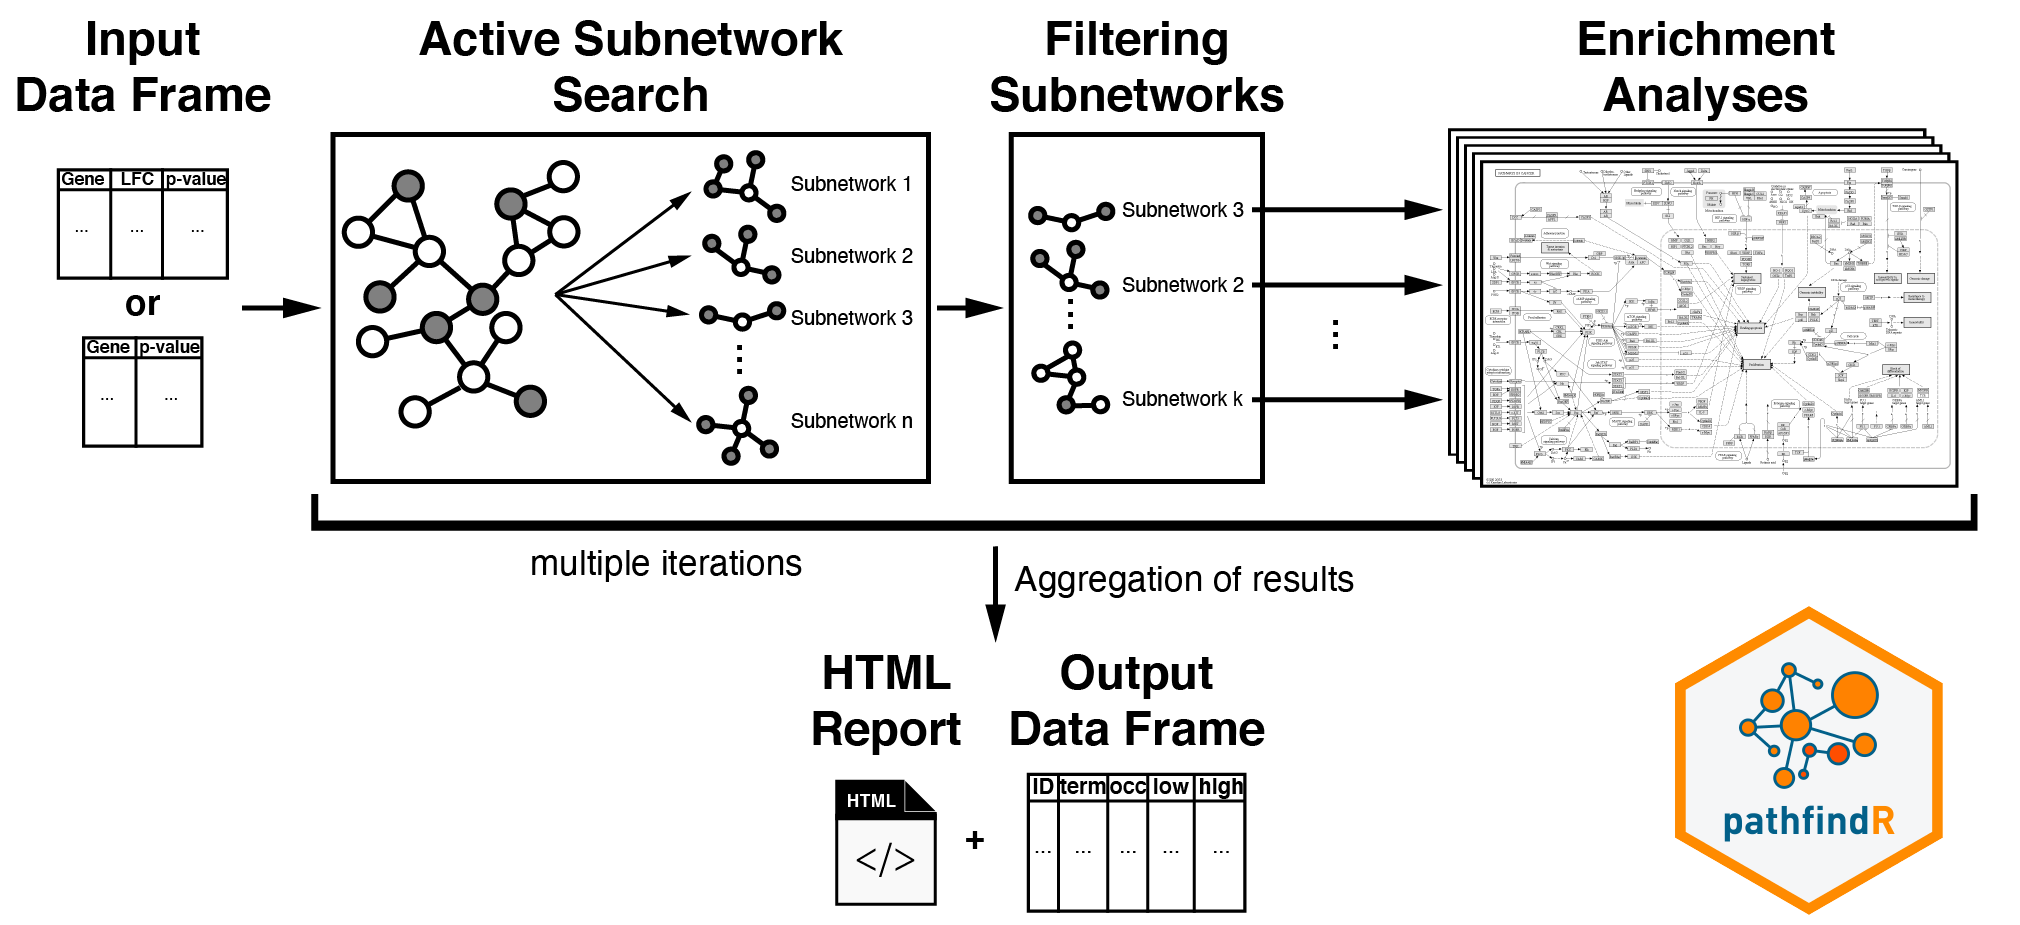
This workflow takes in a data frame consisting of "gene symbols", "change values" (optional) and "associated p values":
```{r example_input, echo=FALSE}
tmp <- RA_input[1:4, ]
tmp$logFC <- round(tmp$logFC,2)
tmp$adj.P.Val <- format(tmp$adj.P.Val, digits = 2)
colnames(tmp) <- c("Gene_symbol", "logFC", "FDR_p")
knitr::kable(tmp, align = c("l", "c", "c"))
```
After input testing, any gene symbol that is not in the chosen protein-protein interaction network (PIN) is converted to an alias symbol if there is an alias that is in the PIN. After mapping the input genes with the associated p values onto the PIN, active subnetwork search is performed. The resulting active subnetworks are then filtered based on their scores and the number of significant genes they contain.
> An active subnetwork can be defined as a group of interconnected genes in a protein-protein interaction network (PIN) that predominantly consists of significantly altered genes. In other words, active subnetworks define distinct disease-associated sets of interacting genes, whether discovered through the original analysis or discovered because of being in interaction with a significant gene.
These filtered list of active subnetworks are then used for enrichment analyses, i.e. using the genes in each of the active subnetworks, the significantly enriched terms (pathways/gene sets) are identified. Enriched terms with adjusted p values larger than the given threshold are discarded and the lowest adjusted p value (over all active subnetworks) for each term is kept. This process of `active subnetwork search + enrichment analyses` is repeated for a selected number of iterations, performed in parallel. Over all iterations, the lowest and the highest adjusted-p values, as well as number of occurrences over all iterations are reported for each significantly enriched term.
This workflow can be run using the function `run_pathfindR()`:
```{r basic_usage, eval=FALSE}
library(pathfindR)
output_df <- run_pathfindR(input_df)
```
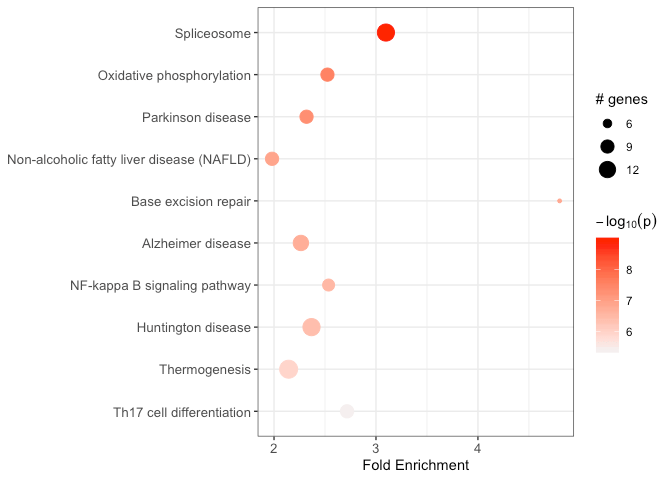
This wrapper function performs the active-subnetwork-oriented enrichment analysis and returns a data frame of enriched terms (as well as visualization of enriched terms and an HTML report):
```{r example_output, echo=FALSE, eval=FALSE}
tmp <- RA_output[1:3, ]
tmp$Up_regulated[1] <- "NDUFA1, NDUFB3, UQCRQ"
tmp$Up_regulated[2] <- "COX7C"
tmp$Up_regulated[3] <- "DDIT3, NDUFA1"
tmp$Down_regulated[1] <- "SNRPB, SF3B2"
tmp$Down_regulated[2] <- "UBE2G1, VDAC1"
tmp$lowest_p <- format(tmp$lowest_p, scientific = TRUE, digits = 2)
tmp$highest_p <- format(tmp$highest_p, scientific = TRUE, digits = 2)
knitr::kable(tmp, align = c("l", "l", "c", "c", "c", "c", "l", "l"))
enrichment_chart(RA_output)
```
Some useful arguments are:
```{r useful_args, eval=FALSE}
# change the output directory
output_df <- run_pathfindR(input_df, output_dir = "/top/secret/results")
# change the gene sets used for analysis (default = "KEGG")
output_df <- run_pathfindR(input_df, gene_sets = "GO-MF")
# change the PIN for active subnetwork search (default = Biogrid)
output_df <- run_pathfindR(input_df, pin_name_path = "IntAct")
# or use an external PIN of your choice
output_df <- run_pathfindR(input_df, pin_name_path = "/path/to/myPIN.sif")
# change the number of iterations (default = 10)
output_df <- run_pathfindR(input_df, iterations = 25)
# report the non-significant active subnetwork genes (for later analyses)
output_df <- run_pathfindR(input_df, list_active_snw_genes = TRUE)
```
The available PINs are "Biogrid", "STRING", "GeneMania", "IntAct", "KEGG" and "mmu_STRING". The available gene sets are "KEGG", "Reactome", "BioCarta", "GO-All", "GO-BP", "GO-CC", "GO-MF", and "mmu_KEGG". You also use a custom PIN (see `?return_pin_path`) or a custom gene set (see `?fetch_gene_set`)
> As of the latest development version, pathfindR offers utility functions for obtaining organism-specific PIN data (for now, only BioGRID PINs) and organism-specific gene sets (KEGG and Reactome) data via `get_pin_file()` and `get_gene_sets_list()`, respectively.
# Clustering of the Enriched Terms
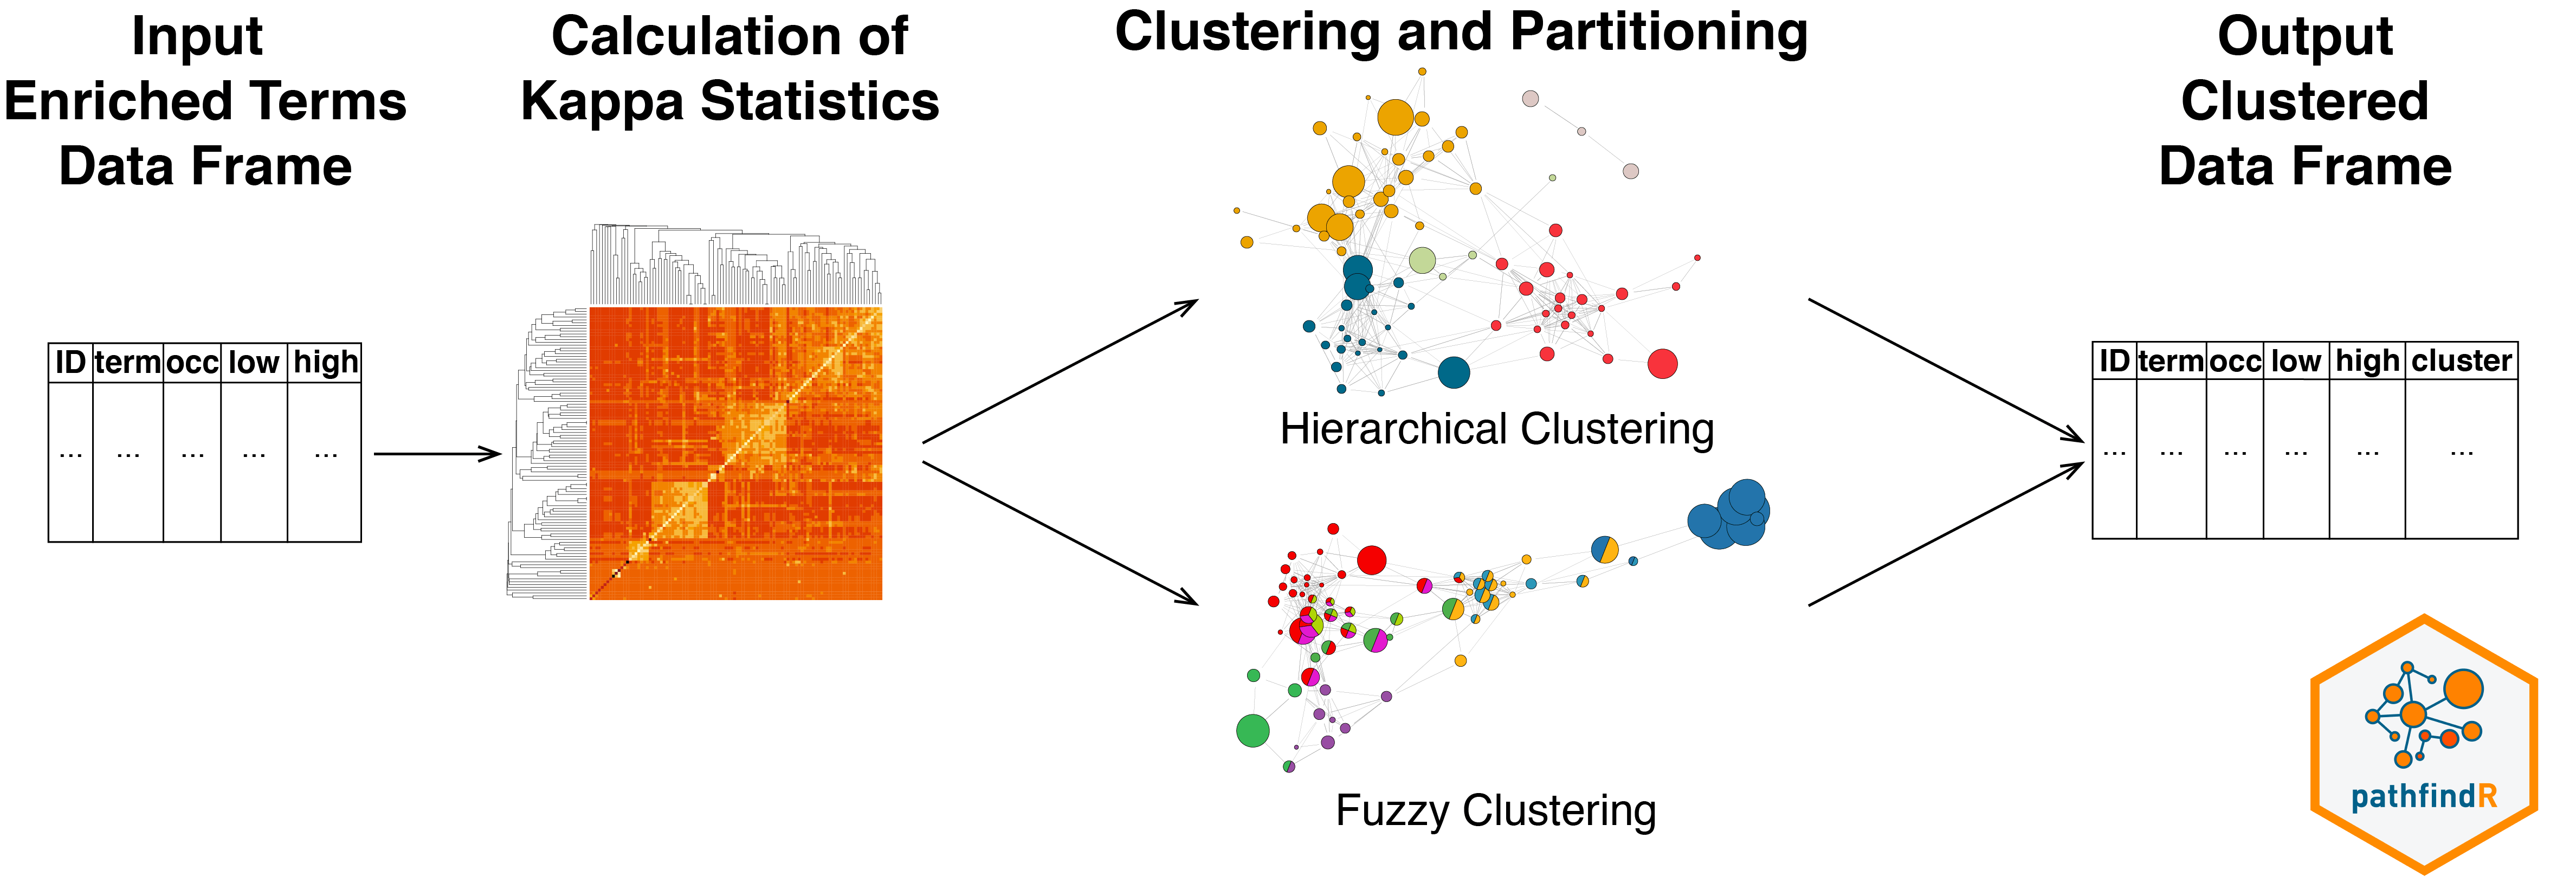
The wrapper function for this workflow is `cluster_enriched_terms()`.
This workflow first calculates the pairwise kappa statistics between the enriched terms. The function then performs hierarchical clustering (by default), automatically determines the optimal number of clusters by maximizing the average silhouette width and returns a data frame with cluster assignments.
```{r clustering_h, eval=FALSE}
# default settings
clustered_df <- cluster_enriched_terms(output_df)
# display the heatmap of hierarchical clustering
clustered_df <- cluster_enriched_terms(output_df, plot_hmap = TRUE)
# display the dendrogram and automatically-determined clusters
clustered_df <- cluster_enriched_terms(output_df, plot_dend = TRUE)
# change agglomeration method (default = "average") for hierarchical clustering
clustered_df <- cluster_enriched_terms(output_df, clu_method = "centroid")
```
Alternatively, the `fuzzy` clustering method (as described in Huang DW, Sherman BT, Tan Q, et al. The DAVID Gene Functional Classification Tool: a novel biological module-centric algorithm to functionally analyze large gene lists. Genome Biol. 2007;8(9):R183.) can be used:
```{r clustering_f, eval=FALSE}
clustered_df_fuzzy <- cluster_enriched_terms(output_df, method = "fuzzy")
```
# Visualization of Enrichment Results
## Term-Gene Heatmap
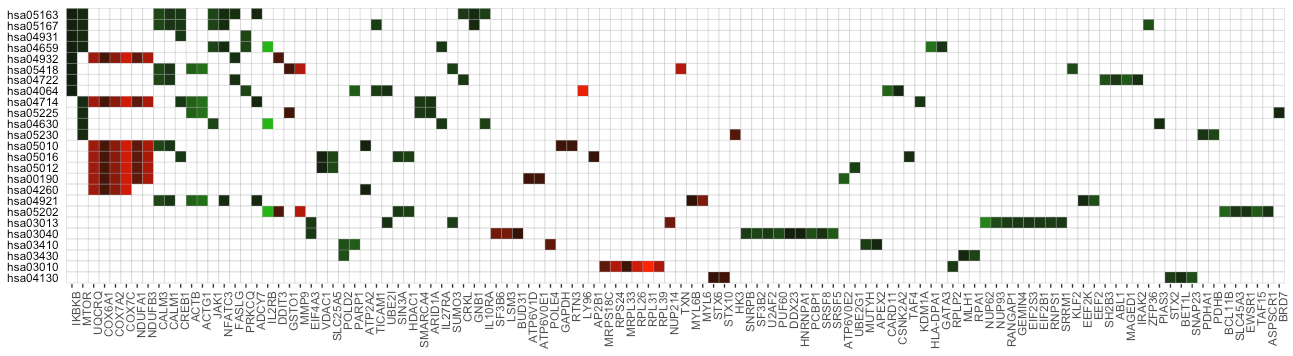
The function `term_gene_heatmap()` can be utilized to visualize the heatmap of enriched terms by the involved input genes. This heatmap allows visual identification of the input genes involved in the enriched terms, as well as the common or distinct genes between different terms. If the input data frame (same as in `run_pathfindR()`) is supplied, the tile colors indicate the change values.
## Term-Gene Graph
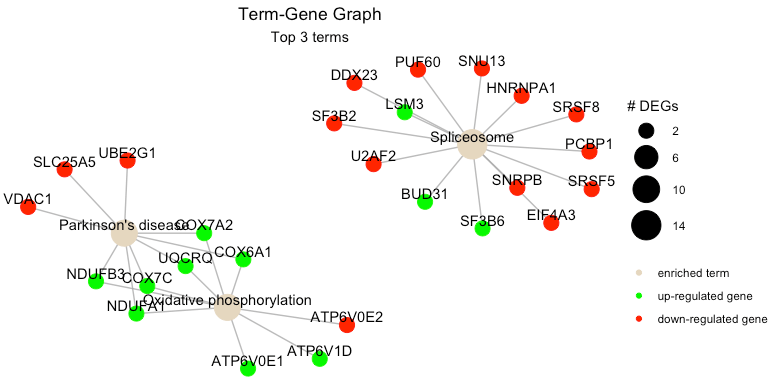
The function `term_gene_graph()` (adapted from the Gene-Concept network visualization by the R package `enrichplot`) can be utilized to visualize which significant genes are involved in the enriched terms. The function creates the term-gene graph, displaying the connections between genes and biological terms (enriched pathways or gene sets). This allows for the investigation of multiple terms to which significant genes are related. The graph also enables determination of the degree of overlap between the enriched terms by identifying shared and/or distinct significant genes.
## UpSet Plot
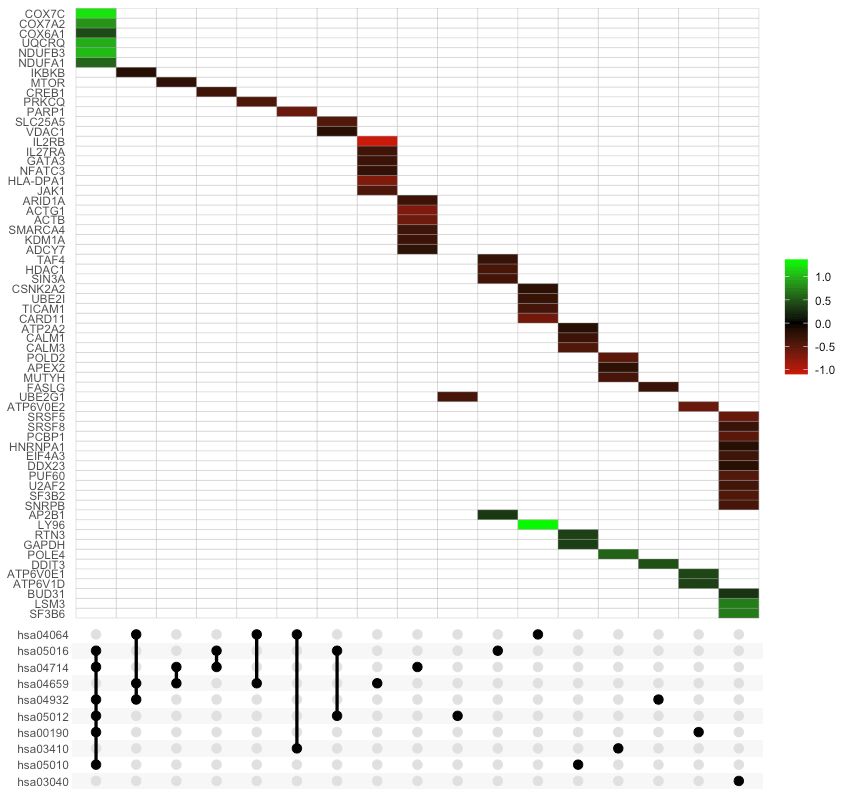
UpSet plots are plots of the intersections of sets as a matrix. This function creates a ggplot object of an UpSet plot where the x-axis is the UpSet plot of intersections of enriched terms. By default (i.e., `method = "heatmap"`), the main plot is a heatmap of genes at the corresponding intersections, colored by up/down regulation (if `genes_df` is provided, colored by change values). If `method = "barplot"`, the main plot is bar plots of the number of genes at the corresponding intersections. Finally, if `method = "boxplot"` and `genes_df` is provided, then the main plot displays the boxplots of change values of the genes at the corresponding intersections.
# Per Sample Enriched Term Scores
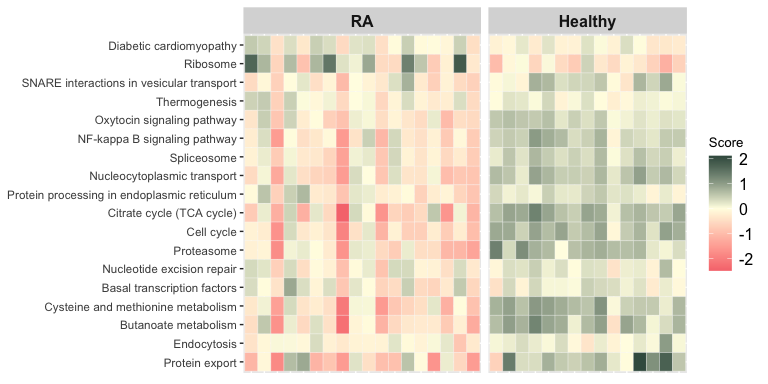
The function `score_terms()` can be used to calculate the agglomerated z score of each enriched term per sample. This allows the user to individually examine the scores and infer how a term is overall altered (activated or repressed) in a given sample or a group of samples.
# Comparison of 2 pathfindR Results
The function `combine_pathfindR_results()` allows combination of two pathfindR active-subnetwork-oriented enrichment analysis results for investigating common and distinct terms between the groups. Below is an example for comparing two different results using rheumatoid arthritis-related data.
```{r compare2res, eval=FALSE}
combined_df <- combine_pathfindR_results(result_A = RA_output,
result_B = RA_comparison_output)
```
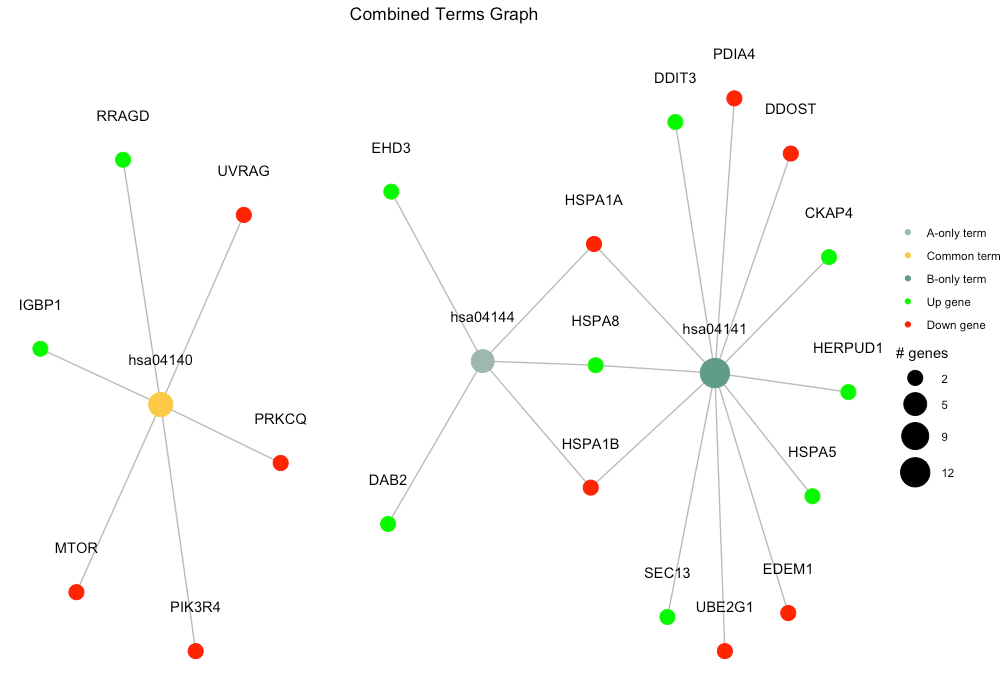
By default, `combine_pathfindR_results()` plots the term-gene graph for the common terms in the combined results. The function `combined_results_graph()` can be used to create this graph (using only selected terms etc.) later on.
```{r compare_graph, eval=FALSE}
combined_results_graph(combined_df, selected_terms = c("hsa04144", "hsa04141", "hsa04140"))
```