Create subplots over groupby rather then by #157
Description
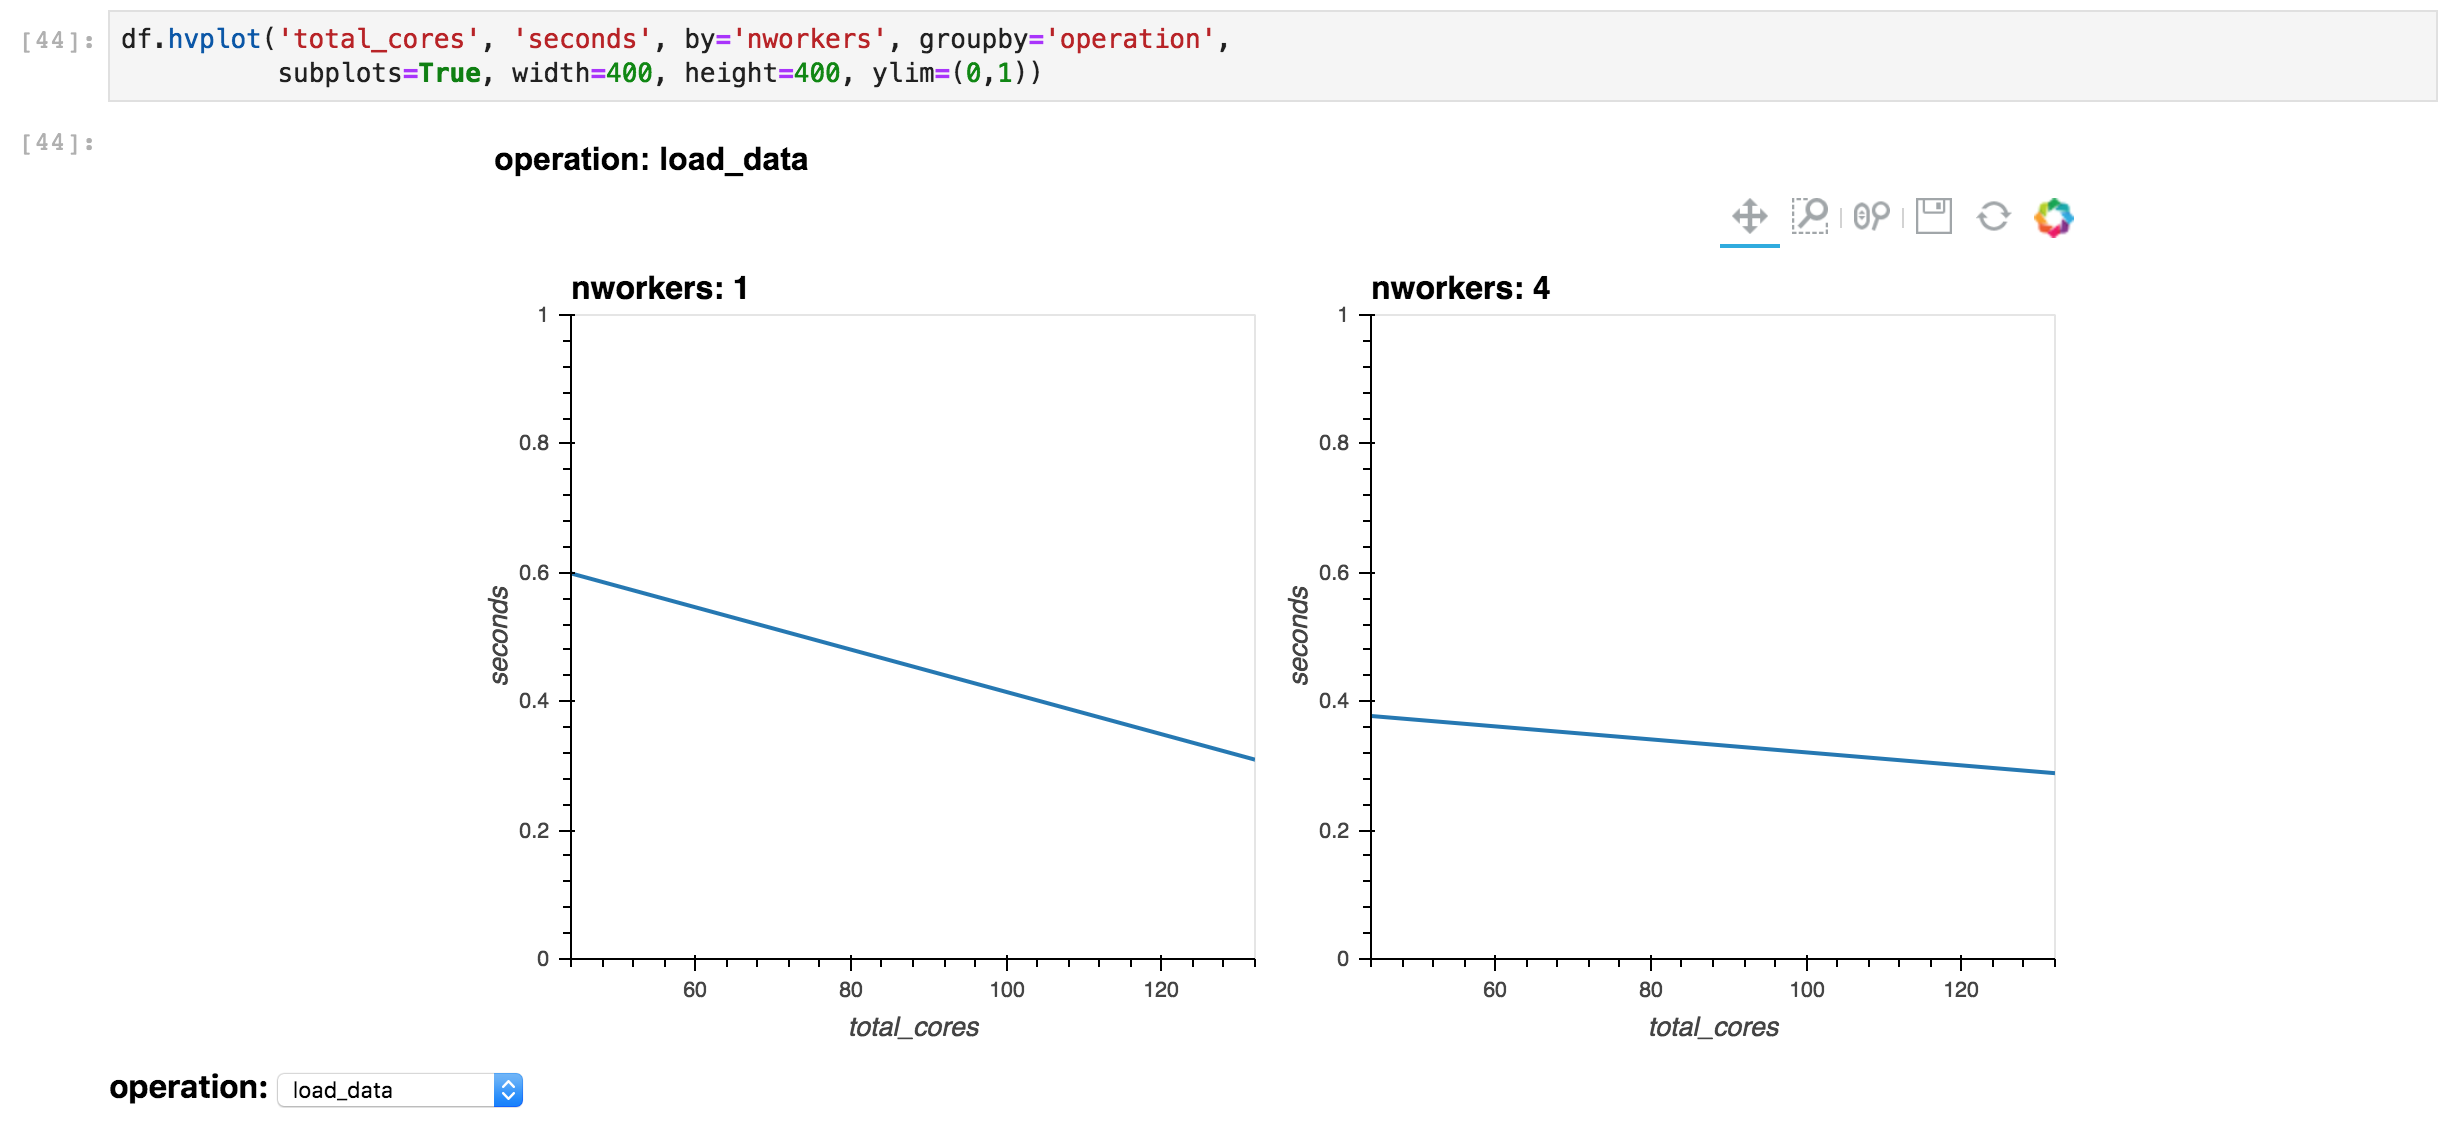
I am not sure how the ambiguity of this should be handled, but I have a plot with both a groupby and a by. I don't want to have a selector widget so I'd like to be able to get subplots using subplots=True. But this splits into subplots over the by field rather than the groupby
To Reproduce:
import pandas as pd
import hvplot.pandas

df = pd.read_csv('benchmarking.txt')
df['total_cores'] = df['njobs'] * df['ncores']

df.hvplot('total_cores', 'seconds', by='nworkers', groupby='operation', subplots=True,
                width=400, height=400, ylim=(0,1))