Name
Trading-ABC
Author
ChaoZhang
Strategy Description
Hello Traders,
For a few months I have been getting requests from my followers about ABC pattern and finally I decided to make this indicator.
How it works?
- It creates Trend Cloud using Simple and Exponential moving averages with the lenghts 50, 100, 150, 200, 20, 40 by default and checks the trend. you can change the lengths as you wish
- It also creates ZigZag using the ZigZag Period in the options.
- Using last 2 zigzag waves it checks if there is suitable ABC pattern according the Trend, the Min/Max Fibonacci levels and Error Rate
- Then it check if the price bounces after this ABC pattern
- And if all these conditions met then it plot triangle
- If there are multiple bouncing then you can see multiple triangles
You can change/set;
- Zigzag Period
- Fibonacci Max level
- Fibonacci Min Level
- Error Rate
- The Lengths that are used for Moving Averages
- Keeping old ABC lines/labels
- Show Zigzag and min/max Fibonacci levels
- Show Trend Cloud
- and colors
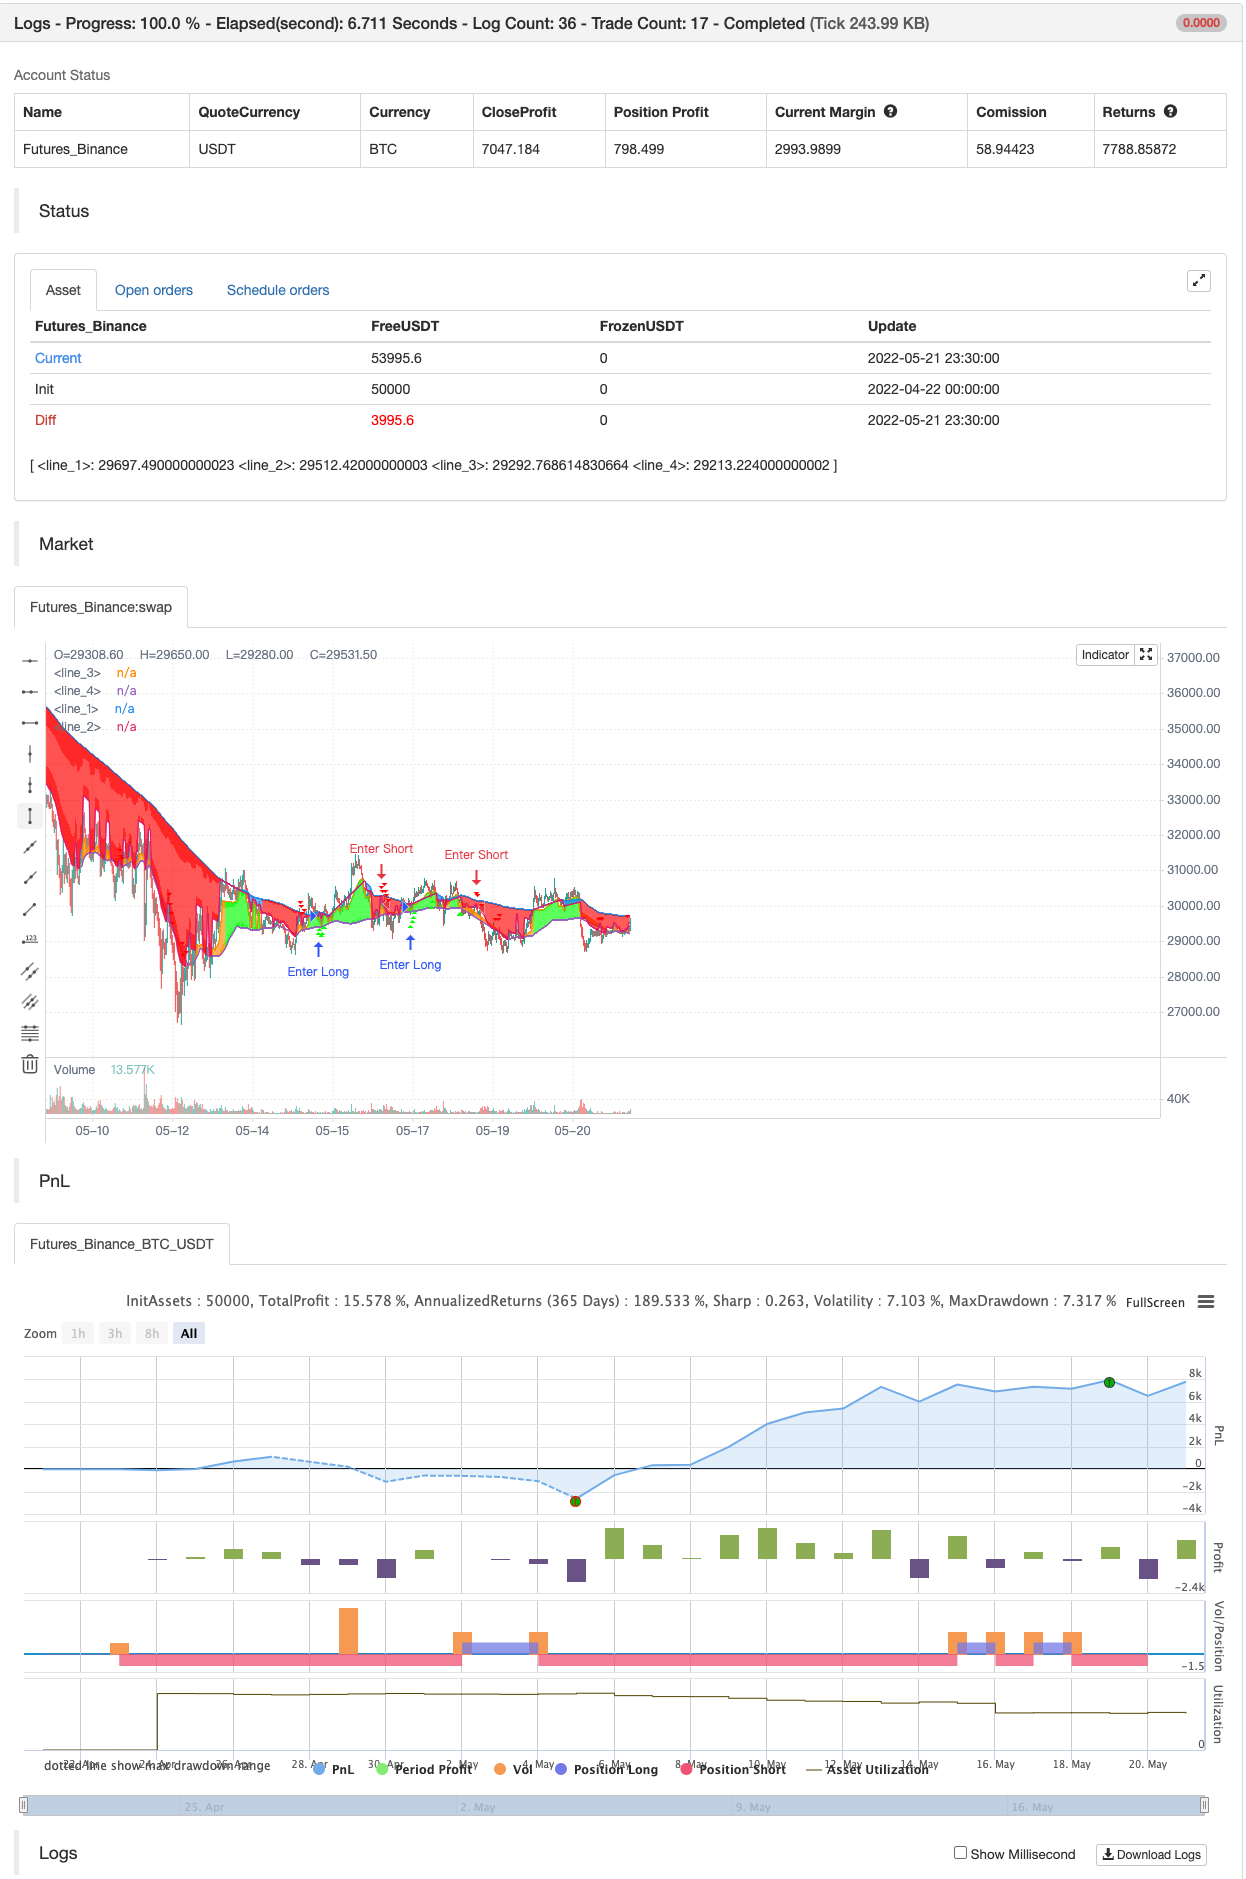
backtest
Strategy Arguments
| Argument | Default | Description |
|---|---|---|
| v_input_1 | 8 | (?Setup)ZigZag Period |
| v_input_2 | 0.618 | Fibonacci Max |
| v_input_3 | 0.382 | Fibonacci Min |
| v_input_4 | 5 | Error Rate |
| v_input_5 | true | (?Extras)Show ABC |
| v_input_6 | true | Keep Old ABCs |
| v_input_7 | true | Show Cloud |
| v_input_8 | lime | c_upcol |
| v_input_9 | red | c_dncol |
| v_input_10 | true | Show Zig Zag & Fibo |
| v_input_11 | lime | upcol |
| v_input_12 | red | dncol |
| v_input_13_close | 0 | (?Trend Cloud)Source for Moving Averages: close |
| v_input_14 | 50 | SMA 1 Length |
| v_input_15 | 100 | SMA 2 Length |
| v_input_16 | 150 | SMA 3 Length |
| v_input_17 | 200 | SMA 4 Length |
| v_input_18 | 20 | EMA 1 Length |
| v_input_19 | 40 | EMA 2 Length |
Source (PineScript)
/*backtest
start: 2022-04-22 00:00:00
end: 2022-05-21 23:59:00
period: 30m
basePeriod: 15m
exchanges: [{"eid":"Futures_Binance","currency":"BTC_USDT"}]
*/

// This source code is subject to the terms of the Mozilla Public License 2.0 at https://mozilla.org/MPL/2.0/
// © LonesomeTheBlue

//@version=4
study("Trading ABC", overlay = true, max_bars_back = 500, max_lines_count = 500, max_labels_count = 500)
prd = input(defval = 8, title="ZigZag Period", minval = 2, maxval = 50, group = "Setup")
fiboup = input(defval = 0.618, title = "Fibonacci Max", group = "Setup")
fibodn = input(defval = 0.382, title = "Fibonacci Min", group = "Setup")
errorrate = input(defval = 5.0, title = "Error Rate", minval = 0, maxval = 30, group = "Setup") / 100
showabc = input(defval = true, title = "Show ABC", group = "Extras")
keepabc = input(defval = true, title = "Keep Old ABCs", group = "Extras")
showcloud = input(defval = true, title = "Show Cloud", group = "Extras", inline = "cloud")
c_upcol = input(defval = color.new(color.lime, 75), title = "", group = "Extras", inline = "cloud")
c_dncol = input(defval = color.new(color.red, 75), title = "", group = "Extras", inline = "cloud")
showzigzag = input(defval = true, title = "Show Zig Zag & Fibo", group = "Extras", inline = "zigzag")
upcol = input(defval = color.lime, title = "", group = "Extras", inline = "zigzag")
dncol = input(defval = color.red, title = "", group = "Extras", inline = "zigzag")
srcma = input(defval = close, title = "Source for Moving Averages", group = "Trend Cloud")
malen1 = input(defval = 50, title = "SMA 1 Length", minval = 1, group = "Trend Cloud")
malen2 = input(defval = 100, title = "SMA 2 Length", minval = 1, group = "Trend Cloud")
malen3 = input(defval = 150, title = "SMA 3 Length", minval = 1, group = "Trend Cloud")
malen4 = input(defval = 200, title = "SMA 4 Length", minval = 1, group = "Trend Cloud")
malen5 = input(defval = 20, title = "EMA 1 Length", minval = 1, group = "Trend Cloud")
malen6 = input(defval = 40, title = "EMA 2 Length", minval = 1, group = "Trend Cloud")

ma_array = array.new_float(6)
array.set(ma_array, 0, sma(srcma, malen1))
array.set(ma_array, 1, sma(srcma, malen2))
array.set(ma_array, 2, sma(srcma, malen3))
array.set(ma_array, 3, sma(srcma, malen4))
array.set(ma_array, 4, ema(srcma, malen5))
array.set(ma_array, 5, ema(srcma, malen6))

float umax = na
float umin = na
float lmax = na
float lmin = na
int upper = 0
int lower = 0
for x = 1 to 6
    ma = array.get(ma_array, x -1)
    if ma >= max(open, close)
        upper := upper + 1
        if na(umax)
            umax := ma
            umin := ma
        else
            umax := max(umax, ma)
            umin := min(umin, ma)
    else if ma <= min(open, close)
        lower := lower + 1
        if na(lmax)
            lmax := ma
            lmin := ma
        else
            lmax := max(lmax, ma)
            lmin := min(lmin, ma)

var int trend = 0
trend := lower > 0 and upper == 0 and lower[1] > 0 and upper[1] == 0 ? 1 :
         lower == 0 and upper > 0 and lower[1] == 0 and upper[1] > 0 ? -1 :
         trend

tucolor = trend ==  1 ? c_upcol: na
tdcolor = trend == -1 ? c_dncol : na
fill(plot(umax, color = na), plot(umin, color = na), color = showcloud ? tdcolor : na)
fill(plot(lmax, color = na), plot(lmin, color = na), color = showcloud ? tucolor : na)

//===================================================================

// zigzag part
get_ph_pl_dir(len)=>
    float ph = highestbars(high, len) == 0 ? high : na
    float pl = lowestbars(low, len) == 0 ? low : na
    var dir = 0
    dir := iff(ph and na(pl), 1, iff(pl and na(ph), -1, dir))
    [ph, pl, dir]

[ph, pl, dir] = get_ph_pl_dir(prd)

var max_array_size = 10
var zigzag = array.new_float(0)

add_to_zigzag(value, bindex)=>
    array.unshift(zigzag, bindex)
    array.unshift(zigzag, value)
    if array.size(zigzag) > max_array_size
        array.pop(zigzag)
        array.pop(zigzag)

update_zigzag(value, bindex)=>
    if array.size(zigzag) == 0
        add_to_zigzag(value, bindex)
    else
        if (dir == 1 and value > array.get(zigzag, 0)) or (dir == -1 and value < array.get(zigzag, 0))
            array.set(zigzag, 0, value)
            array.set(zigzag, 1, bindex)
        0.

dir_changed = change(dir)
if ph or pl
    if dir_changed
        add_to_zigzag(dir == 1 ? ph : pl, bar_index)
    else
        update_zigzag(dir == 1 ? ph : pl, bar_index)

// if showzigzag and array.size(zigzag) > 5
    // var line zzline1 = na
    // var line zzline2 = na
    //line.delete(zzline1)
    //line.delete(zzline2)
   // zzline1 := line.new(x1 = round(array.get(zigzag, 1)) , y1 = array.get(zigzag, 0), x2 = round(array.get(zigzag, 3)), y2 = array.get(zigzag, 2), color = dir == 1 ? upcol : dncol, width = 2, style = line.style_dashed)
    //zzline2 := line.new(x1 = round(array.get(zigzag, 3)) , y1 = array.get(zigzag, 2), x2 = round(array.get(zigzag, 5)), y2 = array.get(zigzag, 4), color = dir == -1 ? upcol : dncol, width = 2, style = line.style_dashed)
    // min/max fibo levels
    // zzlen = abs(array.get(zigzag, 2) - array.get(zigzag, 4))
    // fmin = dir == 1 ? array.get(zigzag, 2) + zzlen * (fibodn - errorrate) : array.get(zigzag, 4) + zzlen * ((1 - fibodn) + errorrate)
    // fmax = dir == 1 ? array.get(zigzag, 2) + zzlen * (fiboup + errorrate) : array.get(zigzag, 4) + zzlen * ((1 - fiboup) - errorrate)
    // var line fibo1 = na
    // var line fibo2 = na
    // line.delete(fibo1)
    // line.delete(fibo2)
    // fibo1 := line.new(x1 = round(array.get(zigzag, 3)), y1 = fmin, x2 = round(array.get(zigzag, 3)) + 1, y2 = fmin, color = color.blue, style = line.style_dashed, extend = extend.right)
    // fibo2 := line.new(x1 = round(array.get(zigzag, 3)), y1 = fmax, x2 = round(array.get(zigzag, 3)) + 1, y2 = fmax, color = color.blue, style = line.style_dashed, extend = extend.right)

zchange = array.size(zigzag) > 0 ? array.get(zigzag, 0) :  0.0
abc = array.new_float(0)
if change(zchange) and array.size(zigzag) > 5 and ((pl and trend == 1  and dir == -1 and low < array.max(ma_array)) or (ph and trend == -1 and dir == 1 and high > array.min(ma_array)))
    a = array.get(zigzag, 0)
    b = array.get(zigzag, 2)
    b_loc = array.get(zigzag, 3)
    c = array.get(zigzag, 4)
    c_loc = array.get(zigzag, 5)
    rate = (a - b) / (c - b)
    if rate >= (fibodn - fibodn * errorrate) and rate <= (fiboup + fiboup * errorrate)
        array.push(abc, b)
        array.push(abc, b_loc)
        array.push(abc, c)
        array.push(abc, c_loc)

// draw_line(dir, x1_,y1_, x2_, y2_, x3_, y3_)=>
//     l1 = line.new(x1 = x1_, y1 = y1_, x2 = x2_, y2 = y2_, color = dir == 1 ? upcol : dncol, width = 2)
//     l2 = line.new(x1 = x2_, y1 = y2_, x2 = x3_, y2 = y3_, color = dir == 1 ? dncol : upcol, width = 2)
//     [l1, l2]

// draw_label(dir, x1_,y1_, x2_, y2_, x3_, y3_)=>
//     alabel = label.new(  x = x1_,
//                          y = y1_,
//                          text = "C",
//                          style = dir == 1 ? label.style_label_down : label.style_label_up,
//                          color = color.new(color.white, 100),
//                          textcolor = color.blue)
//     blabel = label.new(  x = x2_,
//                          y = y2_,
//                          text = "B",
//                          style = dir == -1 ? label.style_label_down : label.style_label_up,
//                          color = color.new(color.white, 100),
//                          textcolor = color.blue)
//     clabel = label.new(  x = x3_,
//                          y = y3_,
//                          text = "A",
//                          style = dir == 1 ? label.style_label_down : label.style_label_up,
//                          color = color.new(color.white, 100),
//                          textcolor = color.blue)
//     [alabel, blabel, clabel]

// var abclines = array.new_line(2)
// var abclabels = array.new_label(3)

// if showabc and array.size(abc) >= 4
//     if not keepabc
//         line.delete(array.pop(abclines))
//         line.delete(array.pop(abclines))
//         label.delete(array.pop(abclabels))
//         label.delete(array.pop(abclabels))
//         label.delete(array.pop(abclabels))

//     [l1_, l2_] = draw_line(dir, bar_index, array.get(zigzag, 0), round(array.get(abc, 1)),  array.get(abc, 0), round(array.get(abc, 3)), array.get(abc, 2))
//     array.unshift(abclines, l1_)
//     array.unshift(abclines, l2_)

//     [la1_, la2_, la3_] = draw_label(dir, bar_index, array.get(zigzag, 0), round(array.get(abc, 1)),  array.get(abc, 0), round(array.get(abc, 3)), array.get(abc, 2))
//     array.unshift(abclabels, la1_)
//     array.unshift(abclabels, la2_)
//     array.unshift(abclabels, la3_)

// bounce?
lbounced = false
sbounced = false
for i = 0 to 5
    if min(low, low[1]) <= array.get(ma_array, i) and close > array.get(ma_array, i) and close > open
        lbounced := true
    if max(high, high[1]) >= array.get(ma_array, i) and close < array.get(ma_array, i) and close < open
        sbounced := true

// stoch give signal?
sto = sma(stoch(close, high, low, 5), 3)
sto_sig = sma(sto, 3)
lstoch = sto[1] <= sto_sig[1] and sto > sto_sig and sto[1] < 50 //and sto_sig > 20
sstoch = sto[1] >= sto_sig[1] and sto < sto_sig  and sto[1] > 50 //and sto_sig < 80

/// check if conditions met
there_is_abc = array.size(abc) != 0
var float last_zz_point = 0.
last_zz_point := array.size(zigzag) > 2 and there_is_abc ? array.get(zigzag, 0) : last_zz_point
var abc_bar_count = 0
abc_bar_count := there_is_abc ? 0 : abc_bar_count + 1
hhh_ = highest(abc_bar_count + 1)
lll_ = lowest(abc_bar_count + 1)

// long condition
long = trend == 1 and abc_bar_count <= 6 and lbounced and lll_ >= last_zz_point
short = trend == -1 and abc_bar_count <= 6 and sbounced and hhh_ <= last_zz_point

plotshape(long,  style = shape.triangleup, color = upcol, location =  location.belowbar, size = size.small)
plotshape(short,  style = shape.triangledown, color = dncol, location =  location.abovebar, size = size.small)

alertcondition(long, title = "ABC Long", message = "ABC Long")
alertcondition(short, title = "ABC Short", message = "ABC Short")


if long
    strategy.entry("Enter Long", strategy.long)
else if short
    strategy.entry("Enter Short", strategy.short)
Detail
https://www.fmz.com/strategy/365127
Last Modified
2022-05-24 10:13:47