Name: V Bhargav Chowdary
Email address: xxxxxxxxxxxx
Contact Number: xxxxxxxxxxxx
Years of Work Experience: xxxxxxxxxxxx
Date: xxxxxxxxx
Modern buildings use a lot of Electrical energy for various applications like heating, cooling, steam and electrical usage. Modern Electrical retrofits can improve the Electrical power efficiency and reduce Electrical consumption and cost. But these retrofits in the scale of a large building can be quite expensive. So, instead of paying the price for retrofits upfront; customers are billed as if the retrofits were not fit for a certain period; till the costs are recovered. Let's assume these variables to be true_cost and assumed_cost ; where true_cost is the actual electrical consumption after retrofits and assumed_cost is the cost that the building would consume if there were no retrofits. The problem at hand is we don't have the assumed_cost information. This could be due to not having enough historical data for the particular building.
"Retrofitting" - refers to the process of updating older equipment with new technology.
But we have historical data of electrical consumption for over 1000 buildings over a year's period. The task is to predict the assumed_cost for a new building using the historical data provided for 1000 buildings.
This competition (https://www.kaggle.com/c/ashrae-energy-prediction/overview) was conducted on Kaggle by ASHRAE (American Society of Heating and Air-Conditioning Engineers) on October 15 2019.
A accurate model would provide better incentives for customers to switch to retrofits. Predicting accurately will smoothen the customer onboarding process and will result in increase in customers. This is because a good model's predictions will result in customers paying the bill amount almost equal to what they would've payed if there were no retrofits; resulting in customers not having to change their expenditures. There are no strict business requirements other than model being highly accurate. Latency requirements are also not high.
This dataset (https://www.kaggle.com/c/ashrae-energy-prediction/data) consists of following 5 files:
-
building_metadata.csv
-
test.csv
-
train.csv
-
weather_test.csv
-
weather_train.csv
>>> building_metadata = pd.read_csv("building_metadata.csv")
>>> building_metadata.shape
(1449, 6)
Few rows from building_metadata.csv
| site_id | building_id | primary_use | square_feet | year_built | floor_count |
|---|---|---|---|---|---|
| 0 | 1 | Education | 7432 | 2008 | |
| 0 | 6 | Lodging/Residential | 27926 | 1981 | |
| 1 | 148 | Office | 174601 | 1960 | 12 |
-
site_id:- unique id of the site. Is an integer from 0 to 15
-
building_id:- unique id of the building. Is an integer from 0 to 1448
-
primary_use:- use of the building. Is a categorical feature of 16 different types out of which
Education(38%) andOffice(19%) are majority features.
>>> building_metadata["primary_use"].unique()
array(['Education', 'Lodging/residential', 'Office',
       'Entertainment/public assembly', 'Other', 'Retail', 'Parking',
       'Public services', 'Warehouse/storage', 'Food sales and service',
       'Religious worship', 'Healthcare', 'Utility', 'Technology/science',
       'Manufacturing/industrial', 'Services'], dtype=object)
>>> len(building_metadata["primary_use"].unique())
16
- use of the building. Is a categorical feature of 16 different types out of which
-
square_feet:- Area of building in sq. feet. Is a number ranging from 283 to 875000
-
year_built:- Built on this year.Is an integer from 1900 to 2007 with about 53% of data having missing values.
-
floor_count:- No. of floors in the building. Is an integer from 1 to 26 with about 76% of data having missing values.
>>> train = pd.read_csv("train.csv")
>>> train.shape
(20216100, 4)
Few rows from train.csv
| building_id | meter | timestamp | meter_reading |
|---|---|---|---|
| 45 | 0 | 2016-01-01 00:00:00 |
0.0 |
| 46 | 0 | 2016-01-01 00:00:00 |
53.2397 |
| 137 | 0 | 2016-03-25 15:00:00 |
50.5156 |
-
building_id:- is the primary key for
building_metadata.csv
- is the primary key for
-
meter:-
is a integer from 0 to 3 indicating one of 4 kinds of meters
-
0,1,2,3 meters are in decreasing order of majority
-
-
timestamp:-
is a timestamp from Jan 1 2016 00:00:00 to Dec 31 2016 23:00:00
-
format is in YYYY-MM-DD, HH:MM:SS where HH is a 24-hr format
-
-
meter_reading:-
is a reading from meter in kWh/kBTU ranging from 0 to 21904700
-
This is typically hourly reading of the respective meter.
-
test.csv has all columns of train.csv except meter_reading column but timestamp of next 2 years i.e from Jan 2017 to Dec 2018
>>> test = pd.read_csv("test.csv")
>>> test.shape
(41697600, 4)Both files have 9 columns.
-
site_id -
timestamp -
air_temperature -
cloud_coverage -
dew_temperature -
precip_depth_1_hr -
sea_level_pressure -
wind_direction -
wind_speed
-
site_id:- is same column discussed before
-
timestamp:-
For weather_train data, it is same as timestamp of train.csv
-
For weather_test data, it is timestamp of test.csv
-
-
air_temperature:- Represents air temperature in celsius.
-
cloud_coverage:- Represents cloud coverage in okta (0~9). About 50% of data is missing.
-
dew_temperature:- Represents dew point temperature.
-
precip_depth_1_h:- Represents depth of precipitation and about 34% of data is missing
-
sea_level_pressure:- Represents sea level pressure
-
wind_direction:- Represents direction of wind from 0 to 360
-
wind_speed:- Represents windspeed. Looks like reading are in miles per hour
This is a standard regression problem so metrics like MSE, R Squared and MAE can be used.
However, kaggle competition is based on Root Mean Square logarithmic Error.
Comparison of RMSE and RMSLE,
Root Mean Square Error (RMSE):
Root Mean Square Logarithmic Errror (RMSLE):
where,
$p_i$ are predicted values and
$a_i$ are actual values.
RMSLE is an extension to RMSE. RMSE has a tendency to heavily penalize high values due to the square term. In RMSLE, by using log we remove this property. RMSLE also penalizes underestimation more than overestimation. Since meter readings range upto 10^8 and we also do not want to underestimate, this metric is suitable for this problem. Overestimation is better than underestimation in this problem since in cost financing underestimation would result in customer paying less than their electric consumption.
\newpage
1. Encoding Cyclical Features for Deep Learning - Kaggle:
This kernel talks about encoding cyclical features for a deep learning model. In our task we have time of the day feature. If we do not properly encode this we get sharp dips from 23 hr to 0 hr of next day when only a period of 1 hr separates them.
The solution proposed in this kernel is to use 2 features : $\sin(2*\pihour/24)$ and $\cos(2\pi*hour/24)$
If we use only one feature, we get same values for 2 different times in a day. Ex, noon and midnight. If we use pairs of features suggested, we get unique pairs for each time period.
2. Aligned Timestamp - LGBM by meter type - Kaggle:
It has been noted by few teams that timestamp in the dataset were not in their local time after discovering that the peak of air temperature being inconsistent, some even having a peak at midnight. The solution proposed in this kernel is to align timestamp so that peak air temperature occurs during 14:00 or 2:00pm. This is a reasonable technique and they have improved their results after this alignment. This especially useful since, when using a model per meter we combine data of all buildings based on meter, so data from different locations are combined. So, it is important to use this kind of alignment to get local times.
3. Estimating Counterfactual Energy Usage of Buildings with Machine Learning - Medium:
This article talks about various feature engineering, model design, imputation and anomaly removal techniques. Since the data is huge (>1GB) a memory reduction technique is performed. This is done by changing each column's datatype into it's suitable format. By doing this we are forcing it to use bare minimum bits to store the information. After doing this there was a significant reduction in memory of files. A week_number feature which can represent the season of the year is added. Since each building is unique in it's own way, rather than combining all the data; data is split and trained per site. Splitting and training based on building id would've resulted in more accurate results but it would require training 1448 models instead of 16. The author also noted that using Lightgbm rather than xgboost resulted in smoother training whereas xgboost resulted in system crashes.
4. Notable points from Kaggle ASHRAE discussions:
-
Leaks:
A lot of public sites have made their electrical power consumption data public. Few kagglers have scraped those data and have found the actual sites in the dataset (site- 0,1,2,3,4,15). Since this was not against the competition rules, most teams competing have leveraged this data to improve their leaderboard positions.
-
Competition conductors have acknowledged that only site 0 meter units are in kBTU instead of kWh. To get units to kWh we have to multiply with 0.2931 and to get to kBTU we multiply 3.4118 for inference.
-
Buildings consuming electricity before built:
Few buildings have power consumptions before the year they are built. This could be due to power usage for construction. These buildings are 28, 45, 46, 99, 103, 363, 409, 567.
-
Weather files may not be in local time:
As discussed in the medium article, it was noted that timestamp data may not be in local time. So timestamp alignment discussed in Solution 2 has to be performed.
5. More Buildings Make More Generalizable Models—Benchmarking Prediction Methods on Open Electrical Meter Data :
https://www.mdpi.com/2504-4990/1/3/56
In section 2 of this paper, various factors that affect fluctuations in power consumption are discussed.
These include:
-
Daily, weekly, seasonal schedules:
Non residential buildings have periods that are occupied and not occupied. These patterns are cyclical and are depended on factors like the type of usage of the building. For instance offices, educational institutions might have a similar daily usage type but not hotels. These schedules are mostly determined by the organization.
-
Human behavior:
This is different than previously discussed in that this is more random and is caused by high demand like scenarios. For instance in a Shopping mall or an Airport when demand is high. In modern buildings this is monitored by cameras or thermostats.
In both the above cases more people requires more power consumption.
-
Weather:
Heating, ventilation and air-conditioning (HVAC) systems are a huge component of energy consumption. Weather plays a major role in amount of load these systems experience. So outside temperature can be an important factor to consider.
-
Non-Routine Events:
These are hard to predict irregular events caused due to system maintenance or equipment failure. These are events that are highly irregular compared to past trends.
6. 1st place solution:
https://www.kaggle.com/c/ashrae-energy-prediction/discussion/124709
In first place solution after preprocessing and feature engineering, they have used an ensemble of per meter, per site and per building & meter combination. They have also used leak data for cross validation. For preprocessing, long streaks of constant values, large positive/ negative spikes and manual visual inspection are removed. For feature engineering, raw features, public holidays and techniques discussed earlier are used. For ensemble, they have used each model per meter, per site and per building,meter pair. This will result in training a huge ensemble.
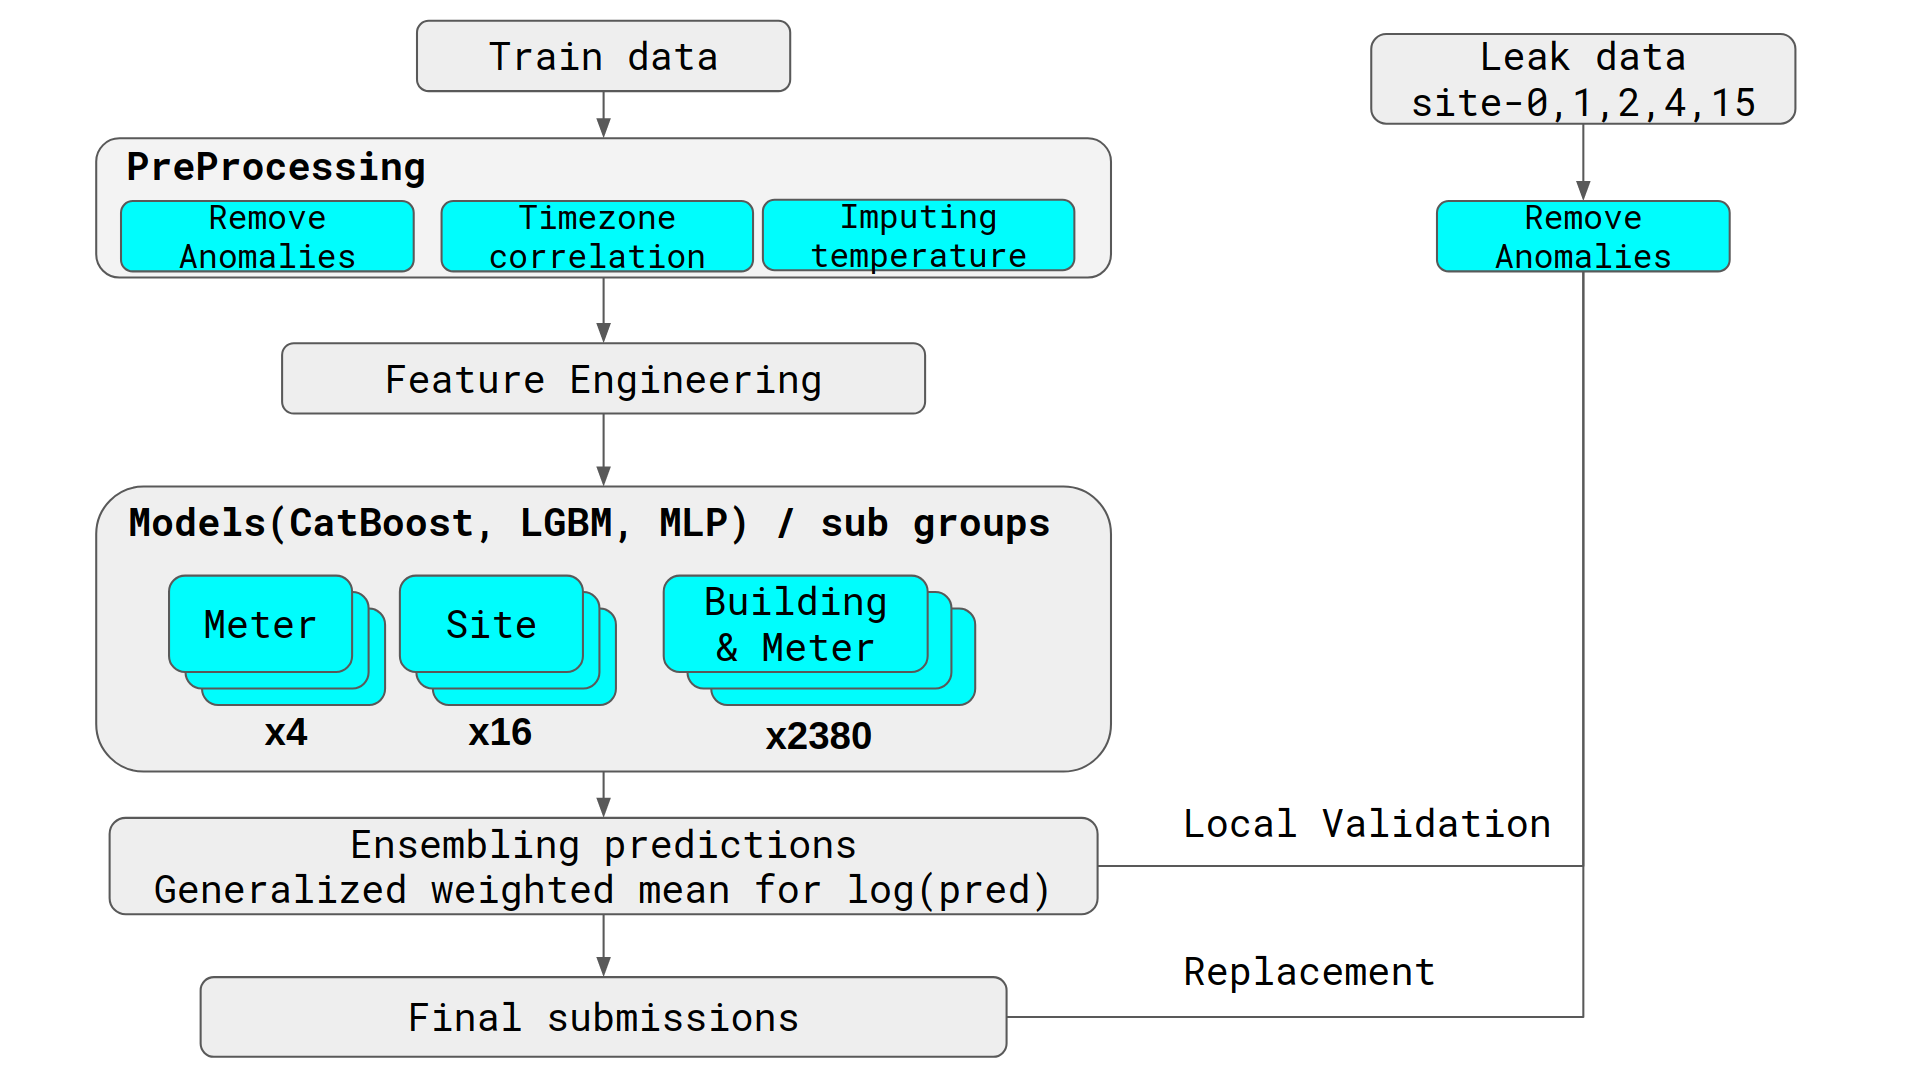
Though this may not be practical but we can employ few techniques used by this team.
\newpage
After researching various solutions and papers discussed above, a rough idea is formed on how to approach the problem.
Steps:
-
Data Loading and Memory reduction:
Download datasets and perform Memory reduction technique discussed in Solution 3.
-
Anomaly removal:
Remove anomalies in meter reading as discussed in solution 3,6.
-
Imputation:
Missing data can be filled using one of imputation techniques discussed in solution 3. We also have to align timestamp as discussed in solution 2.
-
Feature Engineering/ Feature transforms:
Features like week, cyclic encoding of time and raw features can be used to train our models. We can also add features like is_holiday, weekday, month discussed in solution 3.
-
Models/ Ensembles/ Data:
For ensembles meter wise and site wise models are used. We split the data accordingly and feed it to corresponding models. We can employ the leak data and cross fold validation and hyperparameter tuning. Though team in solution 6 have used a complex ensemble we can first try out simpler Lightgbm ensembles using only meter and site wise models.