Data Visualization using Rhinoceros
Visualization of the data is performed in a 3D environment supported by Rhinoceros and its addon Grasshopper for procedural and generative design. Rhinoceros is a broadly software used for 3D modelling and design with a high capacity of reading many different kind of files. Its power has been increased in the last years by the development of Grasshopper as a free addon for the software which allows to generate geometric and spatial feature from data.
Requirements for running viz routine:
- Install Rhino 5 (90-trial version available).
- Install Grasshopper for Rhino
- Install the following libraries fro Grasshopper from Food4Rhino by unlocking the downloaded zip files and copying their contents to the Grashopper components folder, accesible from the Grasshopper menu (File > Special Folders > Components Folder):
The basic workflow with Grasshopper on Rhino is pretty straightforward. After starting Rhinoceros, Grasshopper can be initialized by typing "Grasshopper" on the command line of Rhino. The visualizer script is available here.
A .gh file is the common format for definitions (sets of scripts) for Grasshopper, and it can be opened from the Grasshoper GUI.
For being able to visualize the csv file, the data needs to be formatted and name as defined on the [Data Analysis section of this repository] LINK HERE.
The workflow within the vizualiser has 5 steps which need to be defined by the user as inputs for the main component of the definition (DSSG2017 CycleAtlanta Viz). For connecting inputs and outputs from each component (box-like element), just drag and drop links in between the nodes. The required inputs are:
-
Specify in a new panel the whole path to the CSV file and connectc it to the CSV file path input of the DSSG2017 CycleAtlanta Viz.
-
Press the Reload button on the Vecor Maps component for downloading and displaying OSM data as basemap for the visualization. It will take a while depending on the size of the targeted area. The map area can be recalculated if needed by modifying the location provided in the connected panel.
-
Set the view mode activ on the Rhino GUI: Perspective or Superior.
-
Control the slider for navigating and exploring through the different steps and phases of the loaded ride. By right-clicking on the slide component an animation can be created.
-
If you are in perspective view, an additional parameters from the available in the dataset can be displayed in the vertical axis along the ride path for providing additional information.
Some example of different visualizations are provided as reference.
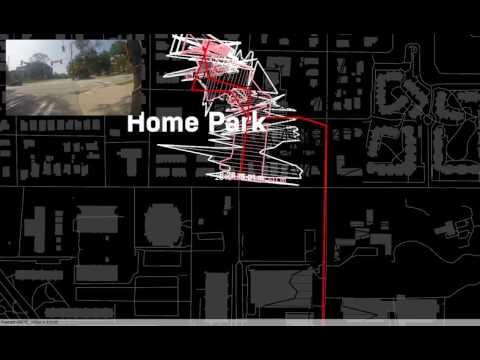
Ride between Midtown and Home Park displaying proximity sensors values. Superior view.
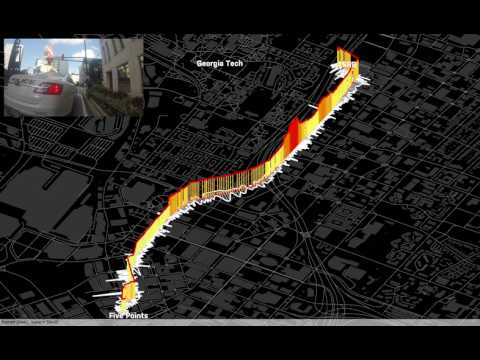
Ride between Midtown and Downtown displaying proximity and PM 10 values. Notice the peak of PM 10 values when crossing a traffic jam on Spring St. Perspective view.
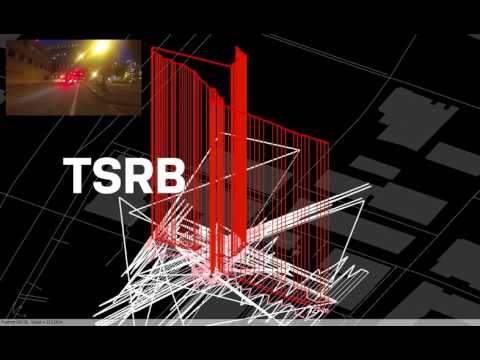
Ride around Midtown displaying proximity and PM 10 values. Notice the huge peak of PM 10 values when crossing West Peachtree St. due to a pollution cloud caused by a malfunctioning car engine. Perspective view.
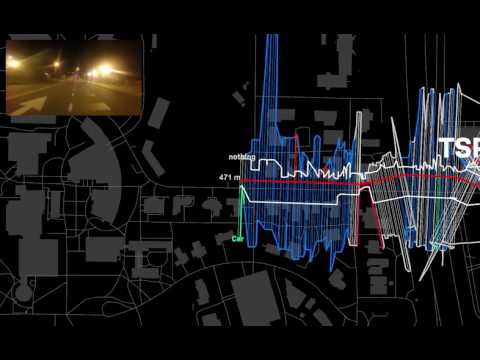
Ride between Midtown and Home Park displaying proximity sensors values and classification of the obstacles detected. Superior view.