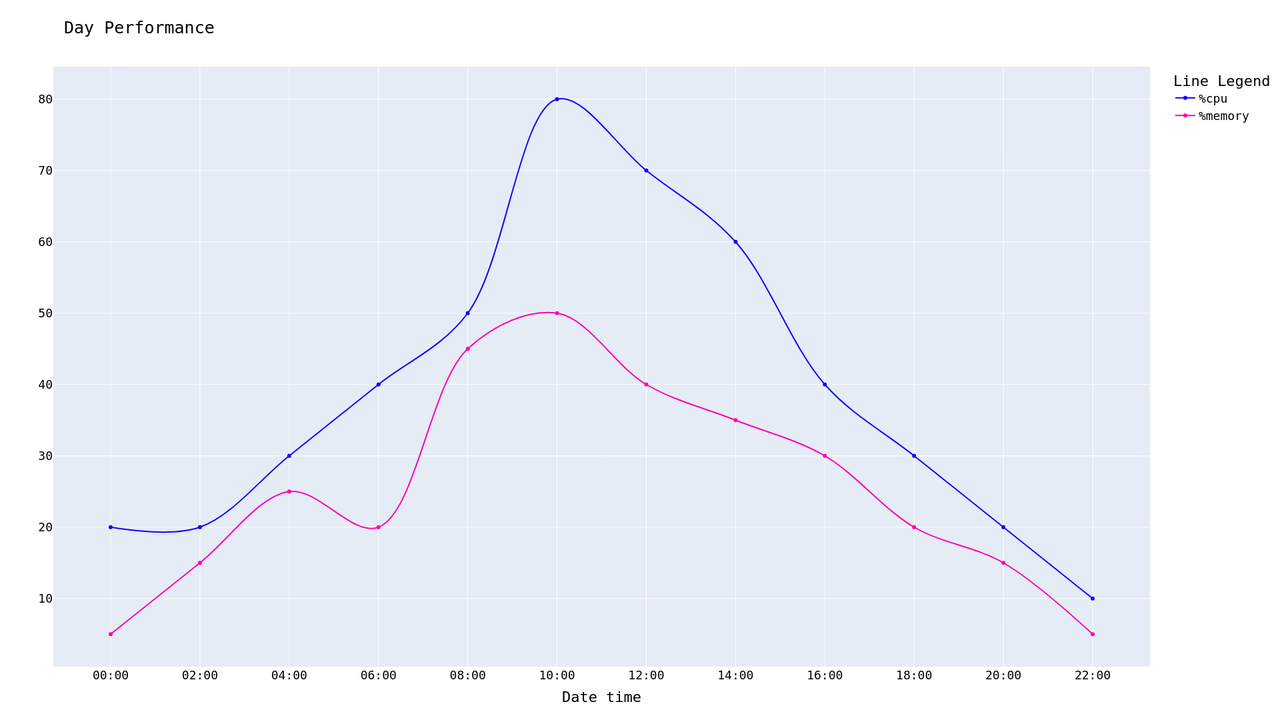
Generate this line chart day_performance_linechart.png in /tmp/chart_collection:
---
- name : set line axis data
set_fact :
xdata : ['00:00','02:00','04:00','06:00','08:00','10:00','12:00','14:00','16:00','18:00','20:00','22:00']
y1data : [20,20,30,40,50,80,70,60,40,30,20,10]
y2data : [05,15,25,20,45,50,40,35,30,20,15,05]
- name : run line chart
become : false
write_charts :
titlechart : " Day Performance" type : line
xaxis : ' {{xdata}}' xaxisname : " Date time" yaxis :
- ' {{y1data}}' ' {{y2data}}' yaxisname :
- " %cpu" " %memory" yaxiscolor :
- " #1500ff" " #ff00b7" titlelegend : " Line Legend" shape_line : " spline" imgwidth : 1920
imgheight : 1080
format : png
path : /tmp/chart_collection
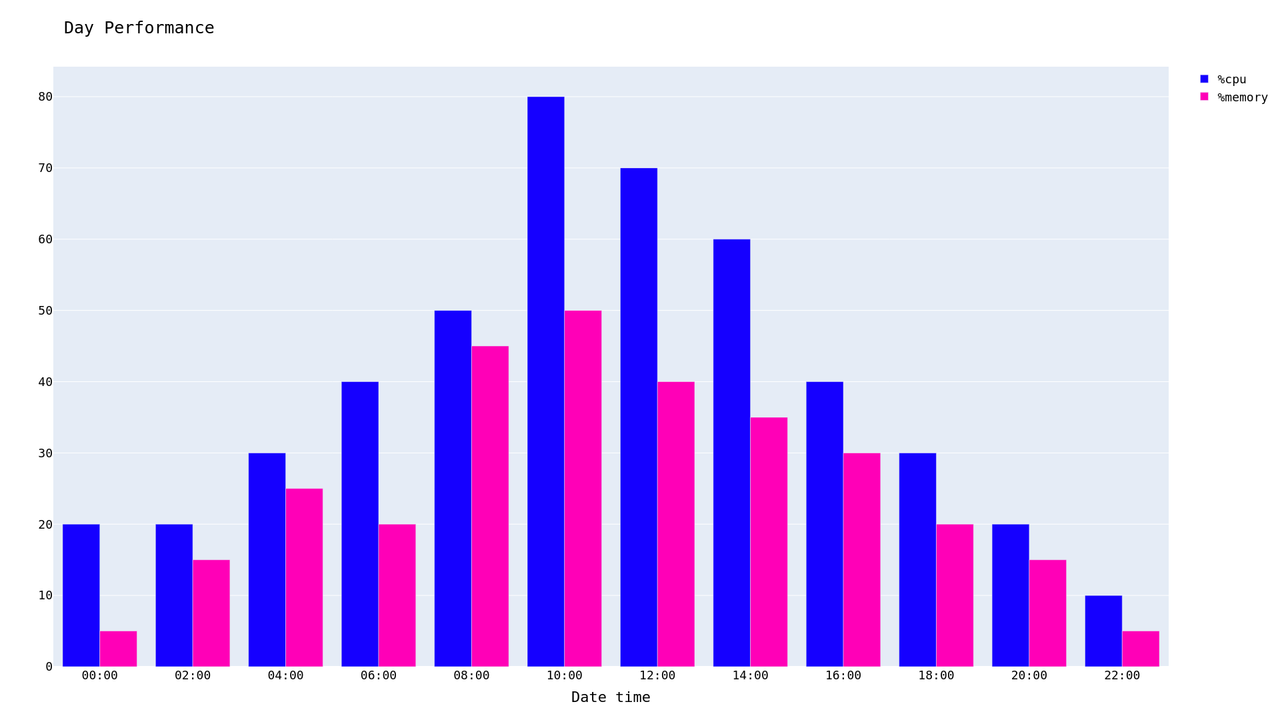
filename : " day_performance_linechart" delegate_to : localhost Generate this bar chart day_performance_barchart.png in /tmp/chart_collection with same data:
---
- name : run bar chart
become : false
write_charts :
titlechart : " Day Performance" type : bar
xaxis : ' {{xdata}}' xaxisname : " Date time" yaxis :
- ' {{y1data}}' ' {{y2data}}' yaxisname :
- " %cpu" " %memory" yaxiscolor :
- " #1500ff" " #ff00b7" imgwidth : 1920
imgheight : 1080
format : png
path : /tmp/chart_collection
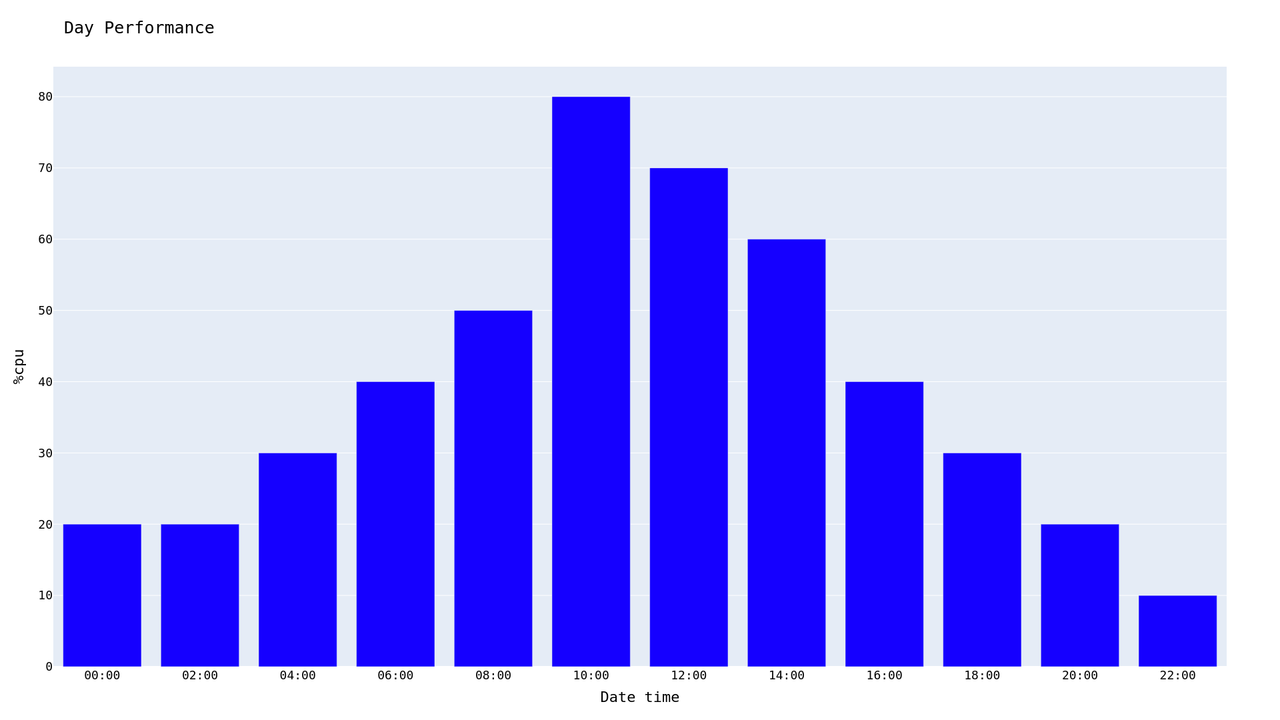
filename : " day_performance_barchart" delegate_to : localhost Generate this bar chart day_performance_barchart.png in /tmp/chart_collection with same X data but only one Y Data :
---
- name : run bar chart
become : false
write_charts :
titlechart : " Day Performance" type : bar
xaxis : ' {{xdata}}' xaxisname : " Date time" yaxis :
- ' {{y1data}}' yaxisname :
- " %cpu" yaxiscolor :
- " #1500ff" imgwidth : 1920
imgheight : 1080
format : png
path : /tmp/chart_collection
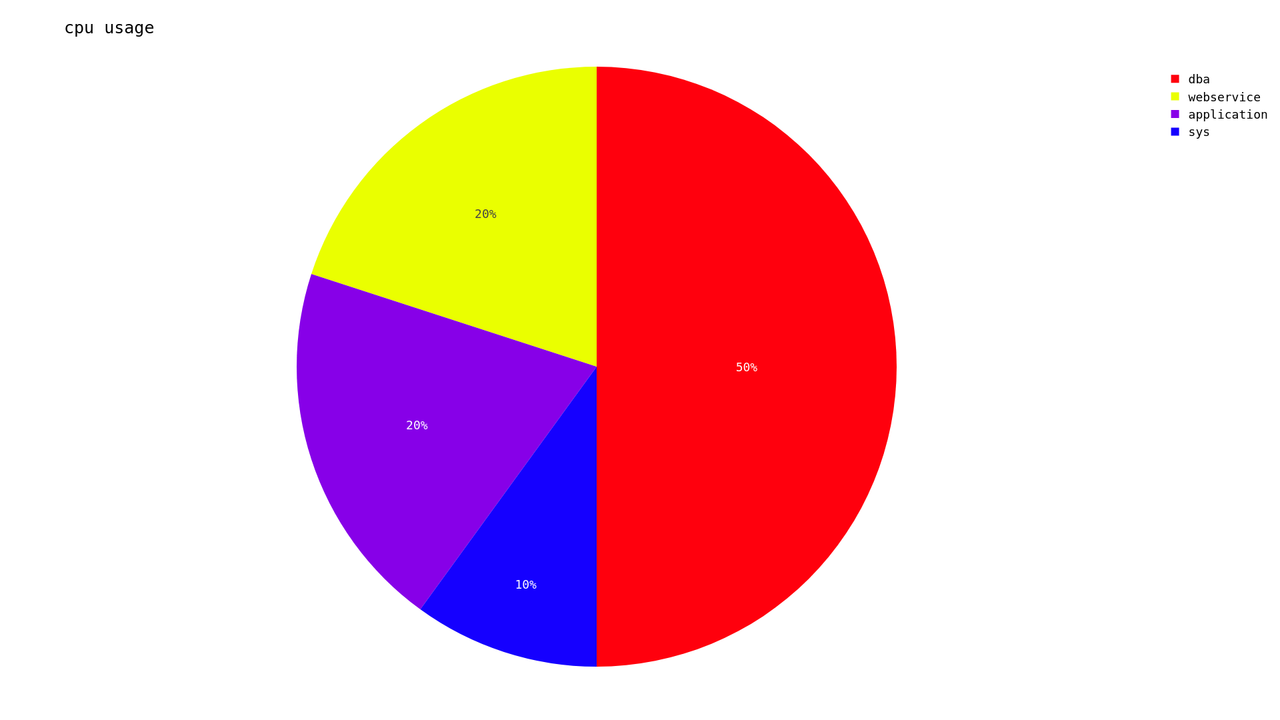
filename : " day_performance_barchart" delegate_to : localhost Generate this pie chart cpu_usage_piechart.png in /tmp/chart_collection:
---
- name : set pie fact
set_fact :
pielabel : ['sys','dba','webservice','application']
piedata : [10, 50, 20, 20]
piecolor : ["#1500ff", "#ff000d", "#eaff00", "#8700e8"]
- name : run pie chart
become : false
write_charts :
titlechart : " cpu usage" type : pie
slicedata : ' {{piedata}}' slicelabel : ' {{pielabel}}' slicecolor : ' {{piecolor}}' imgwidth : 1920
imgheight : 1080
format : png
path : /tmp/chart_collection
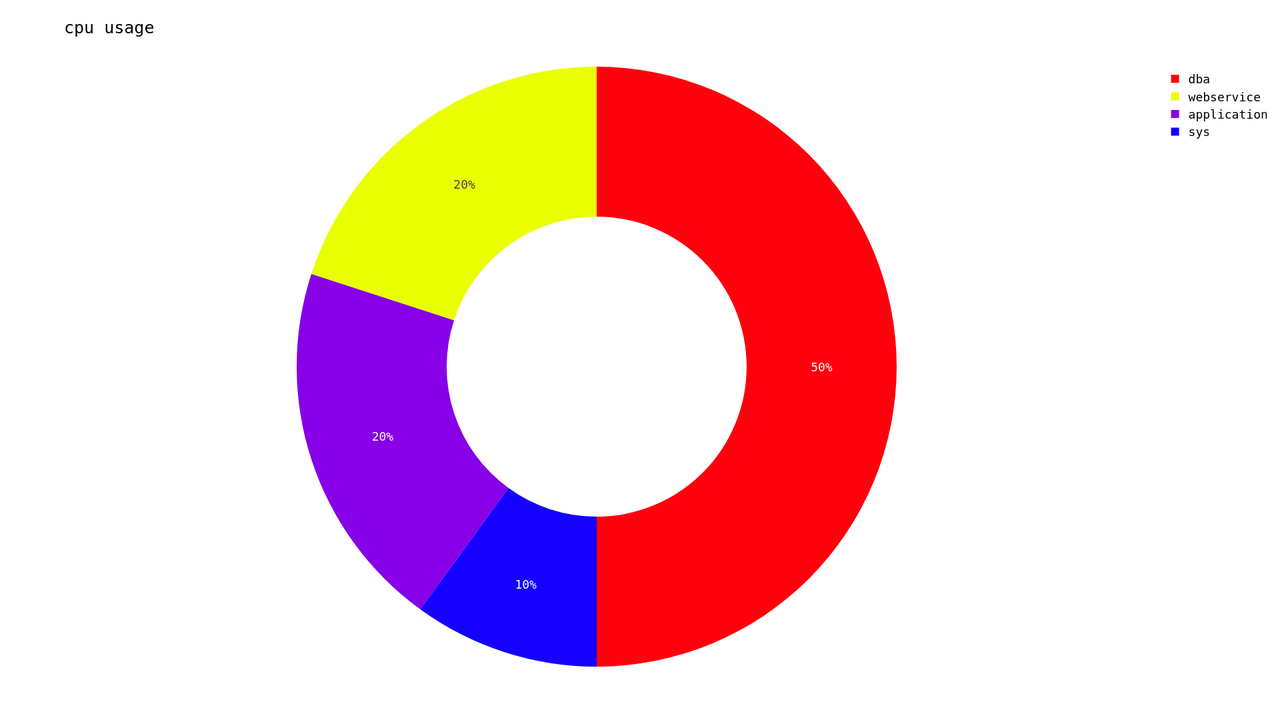
filename : " cpu_usage_piechart" delegate_to : localhost Generate this donut chart cpu_usage_donutchart.png in /tmp/chart_collection with same data:
- name : run donut chart
become : false
write_charts :
titlechart : " cpu usage" type : donut
slicedata : ' {{piedata}}' slicelabel : ' {{pielabel}}' slicecolor : ' {{piecolor}}' sizehole : .5
imgwidth : 1920
imgheight : 1080
format : png
path : /tmp/chart_collection
filename : " cpu_usage_donutchart" delegate_to : localhost