The chart for displaying the grade frequency has a maximum frequency of 5 that it can display.
When 7 students with grade 50 were added, the chart still showed the frequency of 5
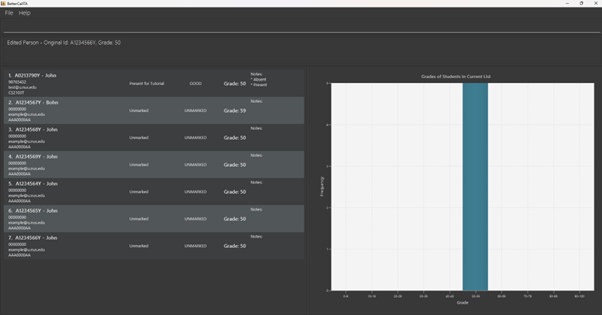
To recreate, add >5 students of any grade boundary and the chart will hit the maximum frequency of 5 and does not show the true value anymore.
As a TA, there will be usually be more than 5 students in a grade boundary, so this artificial limit of 5 can be too restrictive and only able to be used by small classes.
Suggestion could be to make the chart dynamic to scale it to the maximum frequency of any grade boundary
The chart for displaying the grade frequency has a maximum frequency of 5 that it can display.
When 7 students with grade 50 were added, the chart still showed the frequency of 5
To recreate, add >5 students of any grade boundary and the chart will hit the maximum frequency of 5 and does not show the true value anymore.
As a TA, there will be usually be more than 5 students in a grade boundary, so this artificial limit of 5 can be too restrictive and only able to be used by small classes.
Suggestion could be to make the chart dynamic to scale it to the maximum frequency of any grade boundary