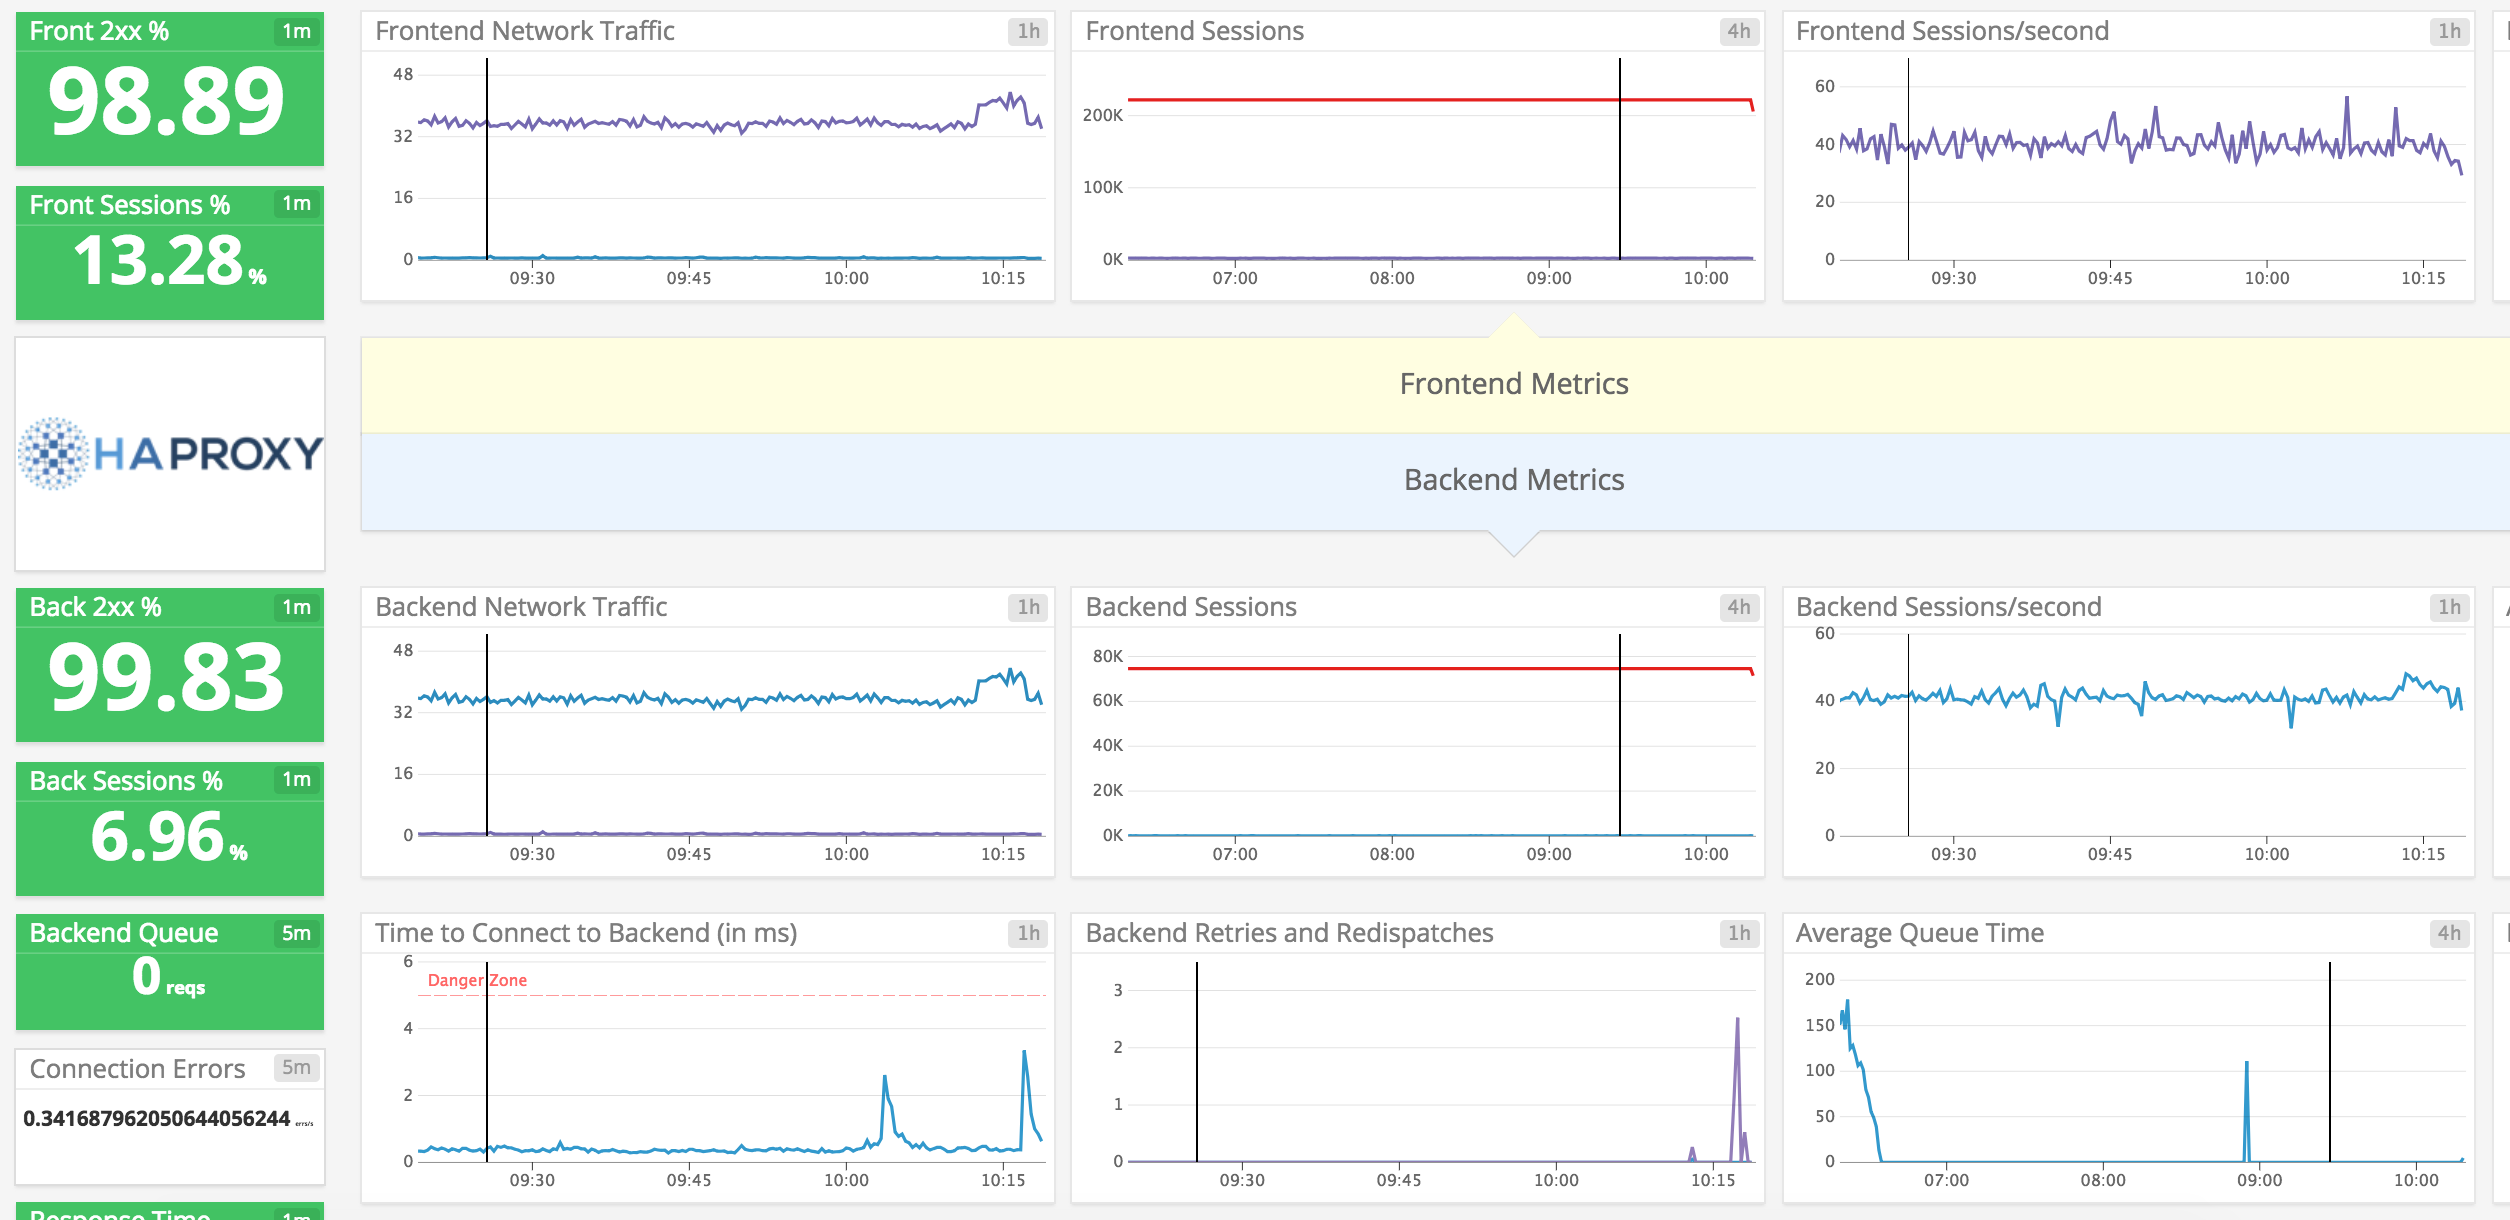
Capture HAProxy activity in Datadog to:
- Visualize HAProxy load-balancing performance.
- Know when a server goes down.
- Correlate the performance of HAProxy with the rest of your applications.
The Haproxy check is included in the Datadog Agent package, so you don't need to install anything else on your Haproxy server.
The Agent collects metrics via a stats endpoint:
-
Configure one in your
haproxy.conf:listen stats # Define a listen section called "stats" bind :9000 # Listen on localhost:9000 mode http stats enable # Enable stats page stats hide-version # Hide HAProxy version stats realm Haproxy\ Statistics # Title text for popup window stats uri /haproxy_stats # Stats URI stats auth Username:Password # Authentication credentials
Follow the instructions below to configure this check for an Agent running on a host. For containerized environments, see the Containerized section.
Edit the haproxy.d/conf.yaml file, in the conf.d/ folder at the root of your Agent's configuration directory to start collecting your HAProxy metrics and logs. See the sample haproxy.d/conf.yaml for all available configuration options.
-
Add this configuration block to your
haproxy.d/conf.yamlfile to start gathering your Haproxy Metrics:init_config: instances: ## @param url - string - required ## Haproxy URL to connect to gather metrics. ## Set the according <USERNAME> and <PASSWORD> or use directly a unix stats ## or admin socket: unix:///var/run/haproxy.sock # - url: http://localhost/admin?stats
Available for Agent versions >6.0
By default Haproxy sends logs over UDP to port 514. The Agent can listen for these logs on this port, however, binding to a port number under 1024 requires elevated permissions. Follow the instructions below to set this up. Alternatively, you can use a different port and skip step 3.
-
Collecting logs is disabled by default in the Datadog Agent, enable it in your
datadog.yamlfile:logs_enabled: true
-
Add this configuration block to your
haproxy.d/conf.yamlfile to start collecting your Haproxy Logs:logs: - type: udp port: 514 service: <SERVICE_NAME> source: haproxy
Change the
serviceparameter value and configure it for your environment. See the sample haproxy.d/conf.yaml for all available configuration options. -
Grant access to port 514 using the
setcapcommand:sudo setcap CAP_NET_BIND_SERVICE=+ep /opt/datadog-agent/bin/agent/agent
Verify the setup is correct by running the
getcapcommand:sudo getcap /opt/datadog-agent/bin/agent/agent
With the expected output:
/opt/datadog-agent/bin/agent/agent = cap_net_bind_service+ep
Note: Re-run this
setcapcommand every time you upgrade the Agent.
For containerized environments, see the Autodiscovery Integration Templates for guidance on applying the parameters below.
| Parameter | Value |
|---|---|
<INTEGRATION_NAME> |
haproxy |
<INIT_CONFIG> |
blank or {} |
<INSTANCE_CONFIG> |
{"url": "https://%%host%%/admin?stats"} |
Available for Agent versions >6.0
Collecting logs is disabled by default in the Datadog Agent. To enable it, see Kubernetes log collection documentation.
| Parameter | Value |
|---|---|
<LOG_CONFIG> |
{"source": "haproxy", "service": "<SERVICE_NAME>"} |
Run the Agent's status subcommand and look for haproxy under the Checks section.
See metadata.csv for a list of metrics provided by this integration.
The Haproxy check does not include any events.
haproxy.backend_up:
Converts the HAProxy status page into service checks.
Returns CRITICAL for a given service if HAProxy is reporting it down.
Returns OK for maint, ok and any other state.
Need help? Contact Datadog support.
